U.S. fluid power product exports dropped 14.3% when compared to last year, reaching 5.6 billion dollars in 2020. Declining nearly one billion dollars since 2019, U.S. fluid power exports faced several challenges, including a recessionary economy brought on by the COVID-19 pandemic as well as an uncertain foreign trade environment due to unstable trade policies, unpredictable sanctions and wavering tariffs. Continued consistency in major trade partner rankings and leading fluid power product export rankings imply that these challenges were equally faced across the globe.
NFPA’s recently released 2020 U.S. Foreign Trade Data for Fluid Power Products highlighted the impact of these trends and more. This annual report includes summarized fluid power product-focused foreign trade data collected by the United States International Trade Commission that breaks down U.S. fluid power import/export activity by both country and product in a trade snapshot summary page, detailed top ten trading partners by fluid power product and trade activity trend graphs.

The 2020 U.S. fluid power exports deviated from an otherwise consistent growth trend, declining 14.3% when compared to 2019.
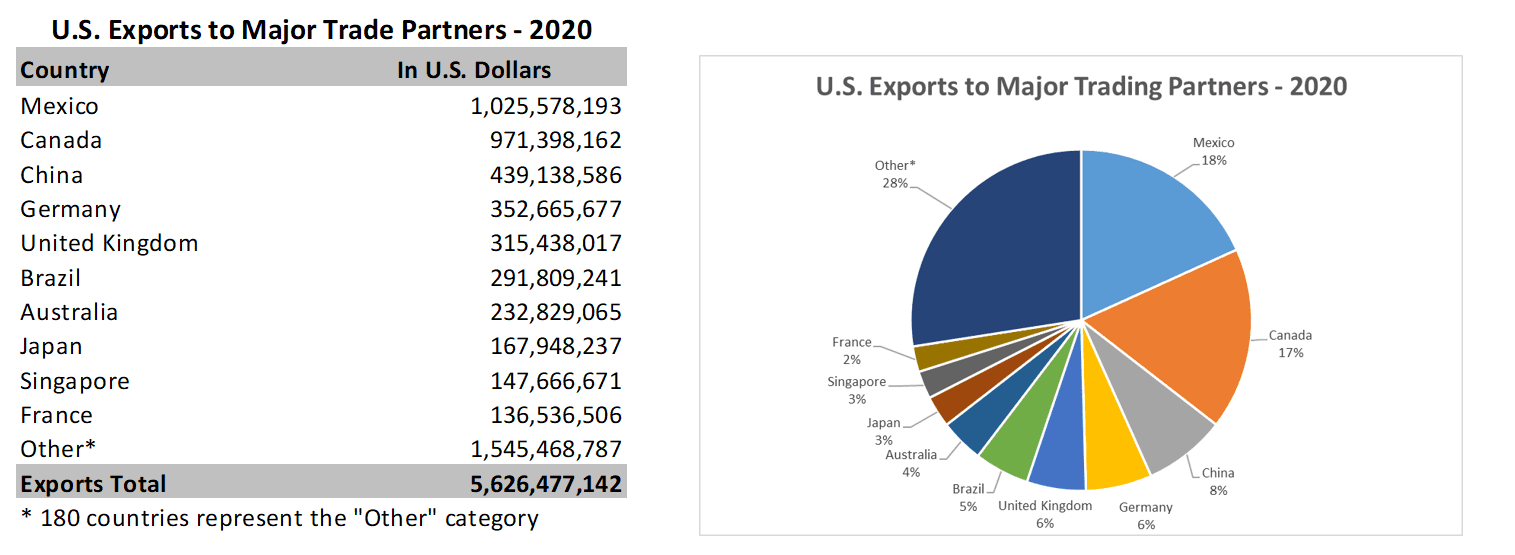
As mentioned earlier, U.S. fluid power exports’ top ten trade partners remained consistent even through the COVID-19 pandemic in 2020. The U.S. fluid power industry’s top five trading partners represent over half of our industry’s exports at 55%, while our top ten trading partners represent 72%. The remaining 28% of our exports is divided amongst 180 other countries.
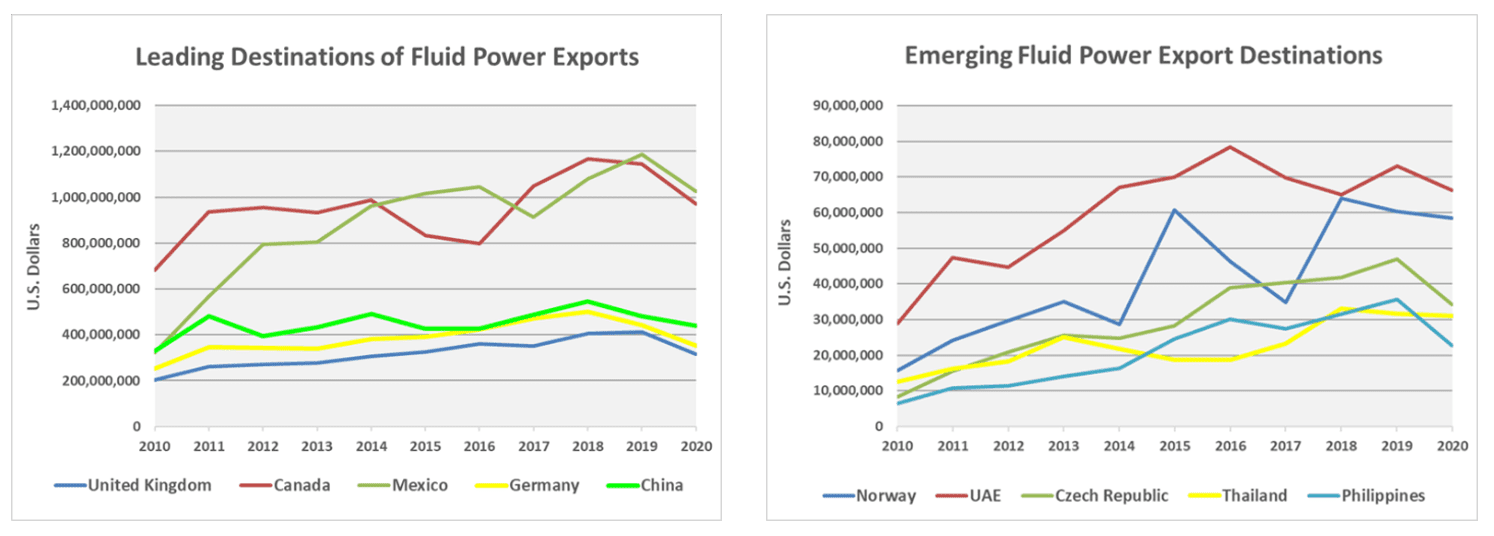
Both leading and emerging destinations of fluid power exports revealed their exposure to an uncertain foreign trade environment in 2020 as well, with declining export activity as displayed on the trend graph above. A combination of compound annual growth rate (CAGR) and total fluid power product export dollars are used to determine emerging destinations.
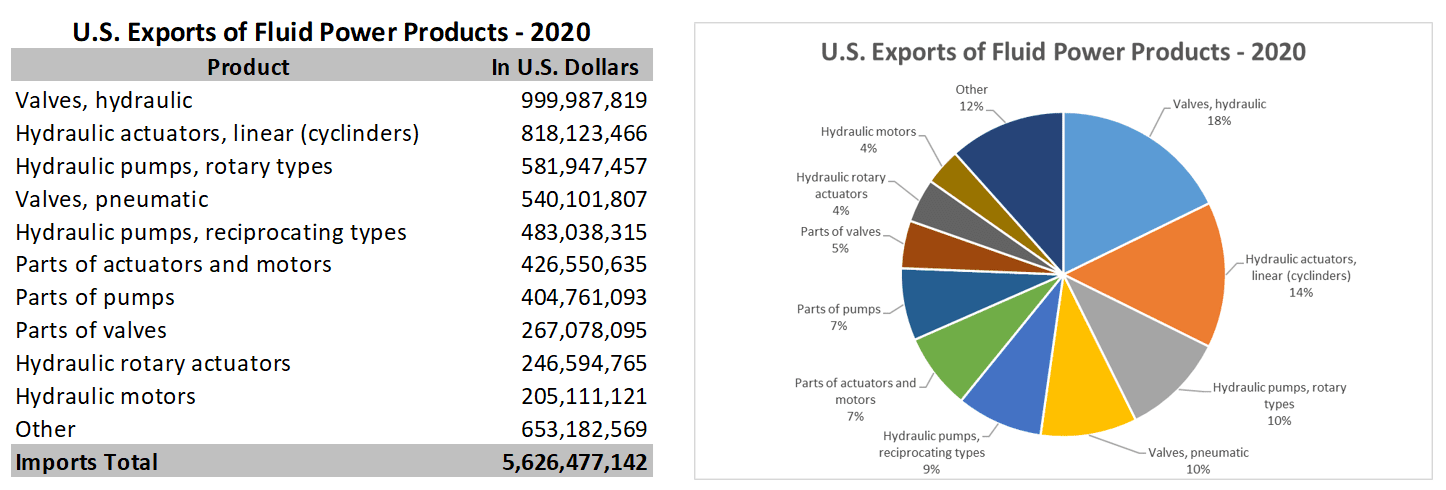
Much like the by-country data, U.S. exports by fluid power product-type experienced no change in top ten rankings, maintaining a trend of consistency throughout the pandemic. The top five fluid power products represent 61% of all U.S. fluid power product exports, while the top ten represent over 88%.
All the data used to generate the graphs and information above can be found in NFPA’s 2020 Foreign Trade Report, an exclusive benefit of NFPA membership. This report is currently available on the NFPA website and can be reached by CLICKING HERE.
Questions? Contact Eric Armstrong at earmstrong@nfpa.com or (414) 778-3372.
Tip: Eric Armstrong also offers a Market Information Resource Walk-Through Webinar for those individuals who are interested in learning more about these valuable resources that are available with your NFPA membership.
Like this post? Share it!
Recent Posts

Q1-Q3 2024 US Trade Data Updated: Mexico Dominates Fluid Power Trade with US
The first three quarters of USITC 2024 data have been released, revealing how it has been measuring up to last year’s US import and export levels of fluid power products. US fluid power exports are on course finishing the year with a growth rate whereas fluid power imports to the US are behind schedule. 2023-dollar…

NAM Regulatory Update: Small Manufacturers: Congress Must Restore Full Expensing
As part of an effort to bring more information about the regulatory and legal environment facing American manufacturers, NFPA is monitoring the newsfeed of the National Association of Manufacturers (NAM) and will be bringing important updates like this to the attention of NFPA members. (October 17, 2024) As part of the NAM’s “Manufacturing Wins” tax…

Breaking the Mold: Inspiring Paths to Leadership in the Fluid Power Industry
This episode of Fluid Power Forum features Jeff Behling, President and CEO of STAUFF Corporation. Listen to the Podcast Here Jeff’s journey from the shop floor to the executive suite is a testament to the power of perseverance, continuous learning, and seizing opportunities. His story is relevant not just because of his unique background but…