Posts Tagged ‘State of the Fluid Power Industry Survey’
Track the Latest Fluid Power Shipment Trends in NFPA’s Stats Dashboard
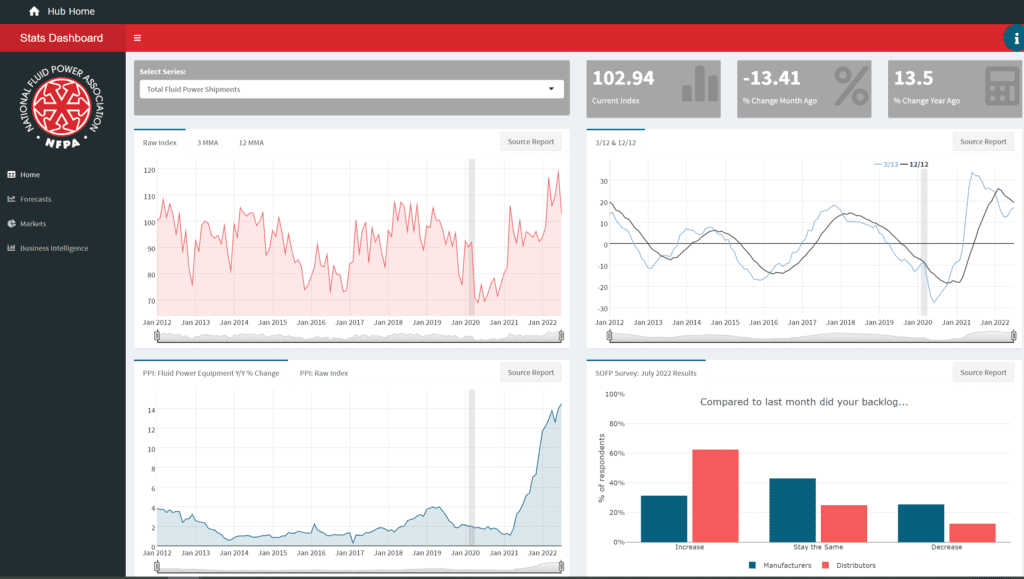
In August 2022, NFPA launched a new Stats Dashboard that helps members easily track the latest fluid power industry data. As an NFPA member, you can access the Stats Dashboard right now on the NFPA member hub (click here to access). Here’s what you should know: What data can I find in the Stats Dashboard? …
Read MoreState of Fluid Power Survey Leads the Way – Don’t Miss This Opportunity
Looking for a strong leading indicator to help plan forward over the next couple quarters? Look no farther than the NFPA State of Fluid Power Industry Survey (SOFP). SOFP is easy to participate in each month. Just answer a few quick opinion-based questions via online survey, but the results are powerful. SOFP is a strong predictor…
Read MoreTake Advantage of NFPA’s Stats Dashboard
In August 2022, NFPA launched a new Stats Dashboard that helps members easily track the latest fluid power industry data. As an NFPA member, you can access the Stats Dashboard right now on the NFPA member hub (click here to access). Here’s what you should know: What data can I find in the Stats Dashboard? …
Read MoreNFPA Surveys as Leading Indicators
NFPA conducts two monthly surveys with its manufacturer members. The State of the Fluid Power (SOFP) survey asks members quick questions about the current state and future of the industry, while Confidential Shipment Statistics (CSS) tracks orders and shipments of fluid power components.One of the questions asked in the SOFP survey reads, “How will the…
Read MoreTrack the Latest Fluid Power Shipment Trends in NFPA’s Stats Dashboard
The latest trends from NFPA’s Confidential Shipment Statistics (CSS) program can be found in the Stats Dashboard. CSS tracks monthly shipments of fluid power products manufactured in the United States. The shipments dollars reported are tied to a base year and presented as indexes to track shipment trends over time. The Stats Dashboard allows members…
Read MoreNew Supply Chain Indicators in Stats Dashboard
New supply chain indicators have been added to the Stats Dashboard. Use the “Supply Chain” tab to view four graphs regarding supply chain pressure, intermodal freight traffic, and freight pricing. Examine the trends over time with data going back to 2000. The four series featured are: Global Supply Chain Pressure Index (Federal Reserve Bank of…
Read MoreNew! NFPA Stats Dashboard
NFPA’s Stats Dashboard is now live! This interactive tool is available to all members. The dashboard highlights data from NFPA’s variety of reports creating a summary of the state of the industry. See the latest trends in shipments, forecasts, and markets all in one location. The dashboard makes it easy to find source data by…
Read MoreFluid Power Hiring Activity Expected to Remain Strong
The latest results from NFPA’s State of the Fluid Power Industry survey give insight into members hiring plans and more. The graph below shows the monthly diffusion index for the question “what best describes your hiring plans over the next 3 months?”. The 3 answer options given to survey participants are: Hire Employees Keep Employment…
Read MoreNew! NFPA Stats Dashboard
NFPA’s Stats Dashboard is now live! This interactive tool is available to all members. The dashboard highlights data from NFPA’s variety of reports creating a summary of the state of the industry. See the latest trends in shipments, forecasts, and markets all in one location. The dashboard makes it easy to find source data by…
Read More