How does your backlog look?
NFPA’s latest State of the Fluid Power (SOFP) industry survey shows 71% of manufacturers reporting an increase in backlog from November to December 2021.
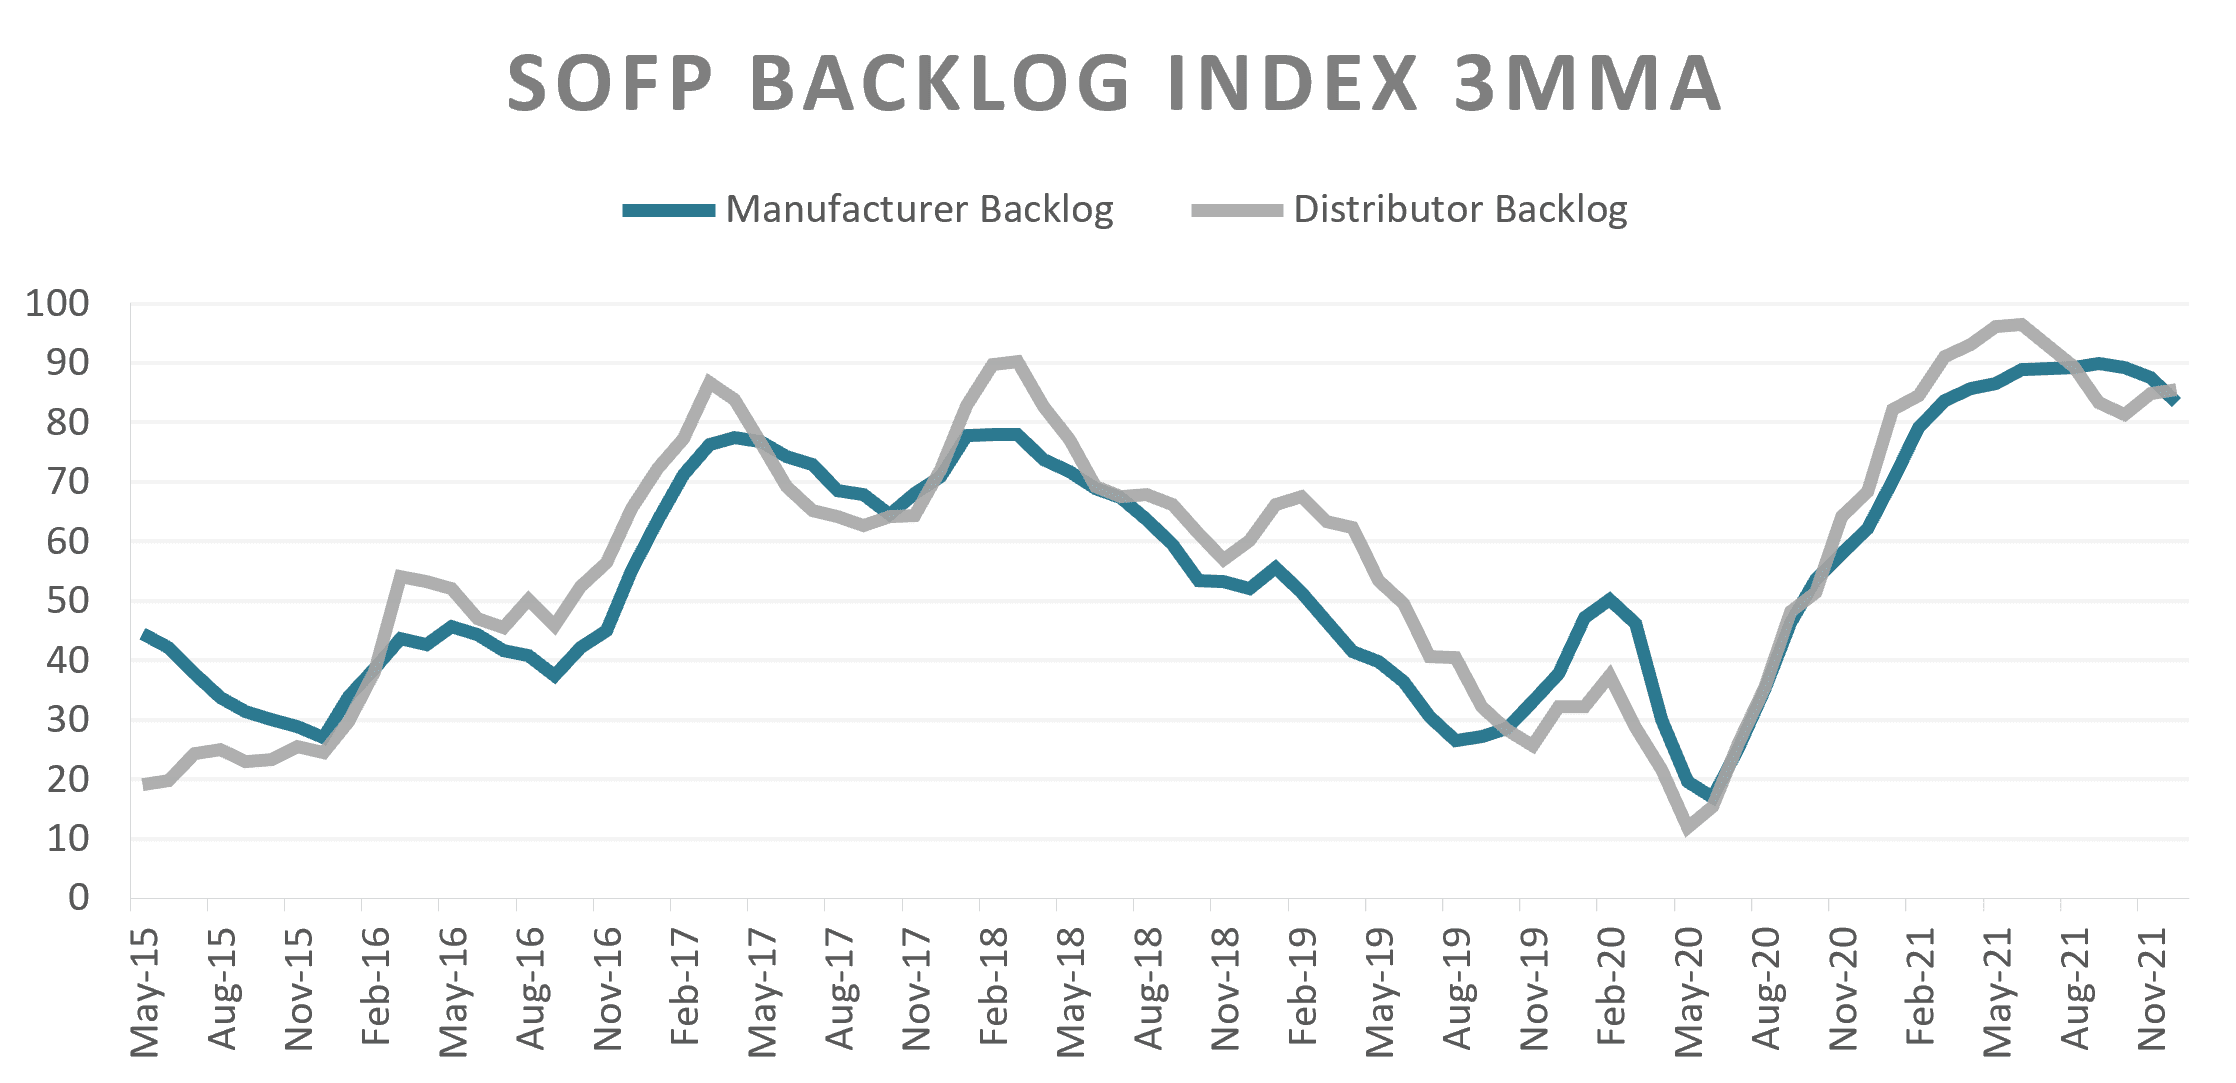
As seen in the graph below, manufacturers and distributors have been saying relatively the same thing about their backlogs increasing or decreasing (higher index = increasing backlog, lower index = decreasing backlog, 50 = same backlog). Over the past year, backlog has been overwhelmingly increasing, though there is some indication of easing for manufacturers.
Why is backlog so high?
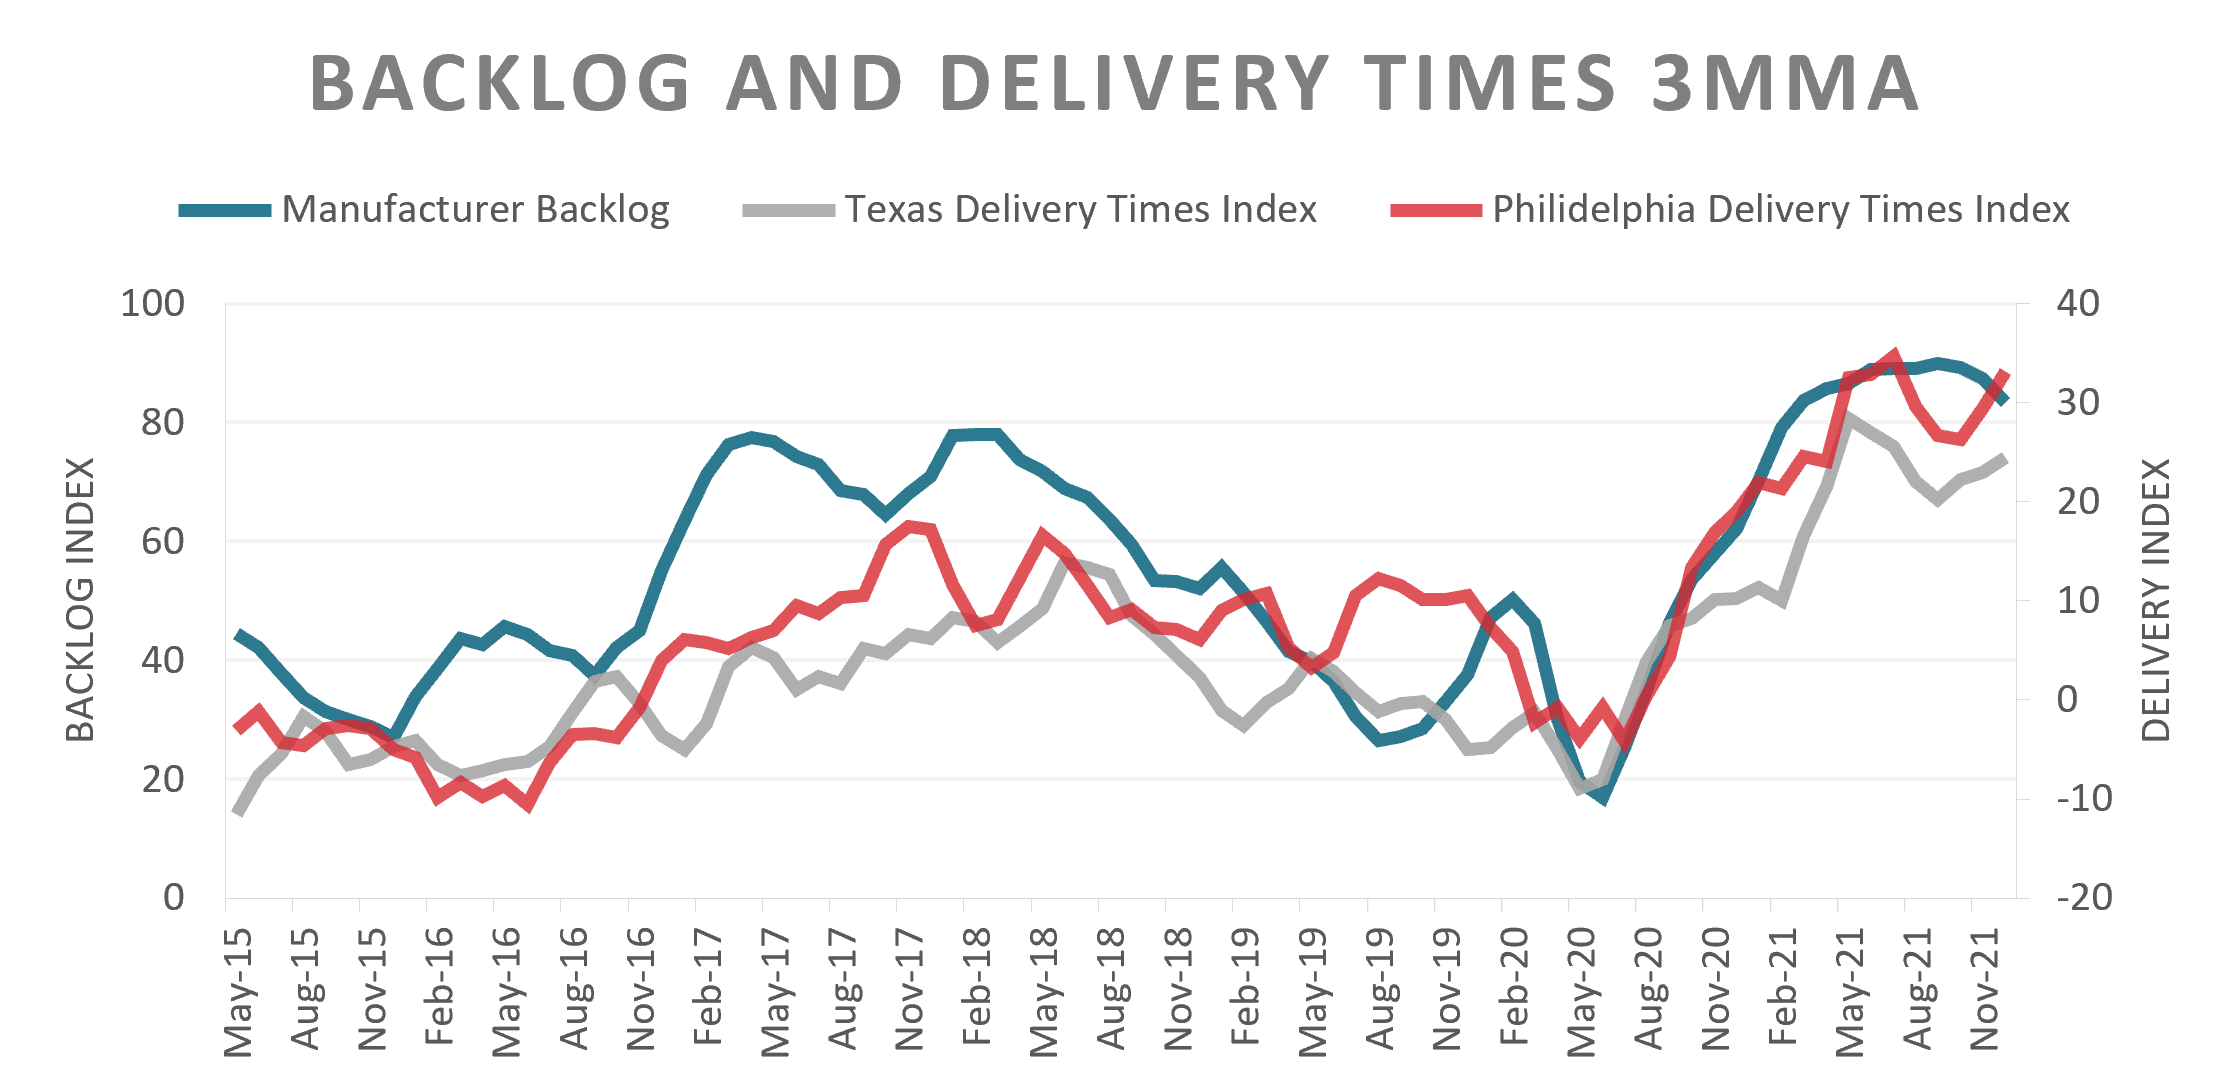
We can look at a few indexes from the Federal Reserve Banks of Texas and Philadelphia regarding manufacturing delivery times. These indexes come from regional manufacturing outlook surveys used to indicate direction of change in overall business activities. The delivery time indexes are calculated by taking the percent reporting increases and subtracting the percent reporting decreases.
Both delivery time indexes are over 75% correlated with NFPA’s SOFP backlog index. Below, you can see how they trend similarly and started increasing around May 2020.
When will backlog pressures ease?
The Institute of Supply Management conducts a Supplier Deliveries Index (not shown). This index peaked at 78.8 in May 2021 (similar to the SOFP index peak above) and has since started a downward trend. In the latest Global Fluid Power Report and Forecast, Oxford Economics states,“ although the worst supply-chain disruptions are likely to have peaked, it will take several quarters for pressures to unwind.” This is consistent with the current trajectory of the Manufacturer SOFP backlog index.
If you are interested in participating in NFPA’s State of the Fluid Power industry survey, please contact Sam Diedrich at sdiedrich@nfpa.com or (414) 778-3372.
Like this post? Share it!
Recent Posts

Fall 2024 Fluid Power Recruitment Event with NIU
RSVP for our Fall 2024 Fluid Power Recruitment Event with Northern Illinois University (NIU). NIU is one of seven universities recognized as a Power Partner, teaching fluid power competencies and engaging in all NFPA educational programs. At this event, your company will have the opportunity to connect directly with NIU engineering students. Engaging in meaningful conversations,…

Now Announcing: Cuyahoga Community College as a Fast Track Hub in Ohio
NFPA’s Fast Track to Fluid Power is a workforce development pathway that partners local technical colleges with fluid power industry members and high school teachers. These networks create awareness and interest in fluid power and train students along a path that leads to careers in fluid power at NFPA member companies. We are pleased to…

Now Announcing: Houston Community College as a Fast Track Hub in Texas
NFPA’s Fast Track to Fluid Power is a workforce development pathway that partners local technical colleges with fluid power industry members and high school teachers. These networks create awareness and interest in fluid power and train students along a path that leads to careers in fluid power at NFPA member companies. We are pleased to…