As many of you may know, the National Fluid Power Association (NFPA) is the leading source of hydraulic and pneumatic industry data. Members get and use our data in a variety of ways to run their businesses. Part of our market information services is providing overall industry trends. Here is the latest update:
Hydraulic and Pneumatic Shipments
This graph of raw index data is generated by the total dollar volume reported to NFPA by CSS participants and compared to the average monthly dollar volume in 2018. For example, the September 2021 total dollar volume for pneumatic shipments is 102.1% of the average monthly dollar volume in 2018. (Base Year 2018 = 100)
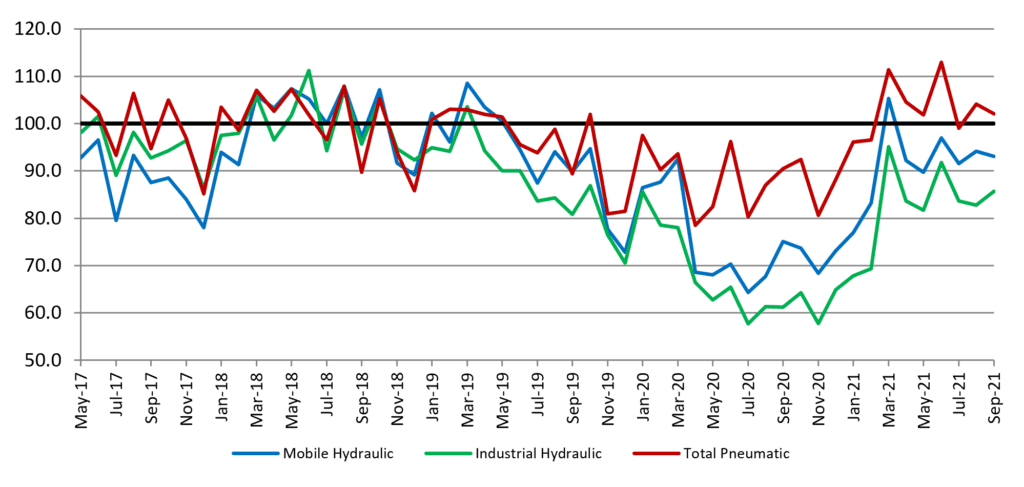
Pneumatic, Mobile and Industrial Hydraulic Orders Index
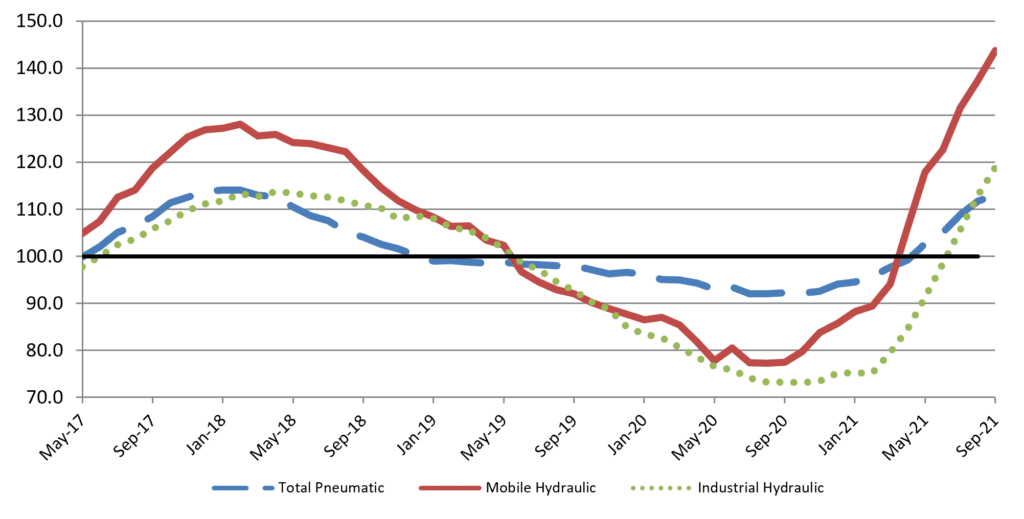
Each point on this graph represents the most recent 12 months of orders compared to the previous 12 months of orders. Each point can be read as a percentage. For example, 118.9 (the September 2021 level of the industrial hydraulic series) indicates that industrial hydraulic orders received from October 2020 to September 2021 were 118.9% of the orders received from October 2019 to September 2020. (Base Year 2018 = 100)
Total Hydraulic and Pneumatic Shipments
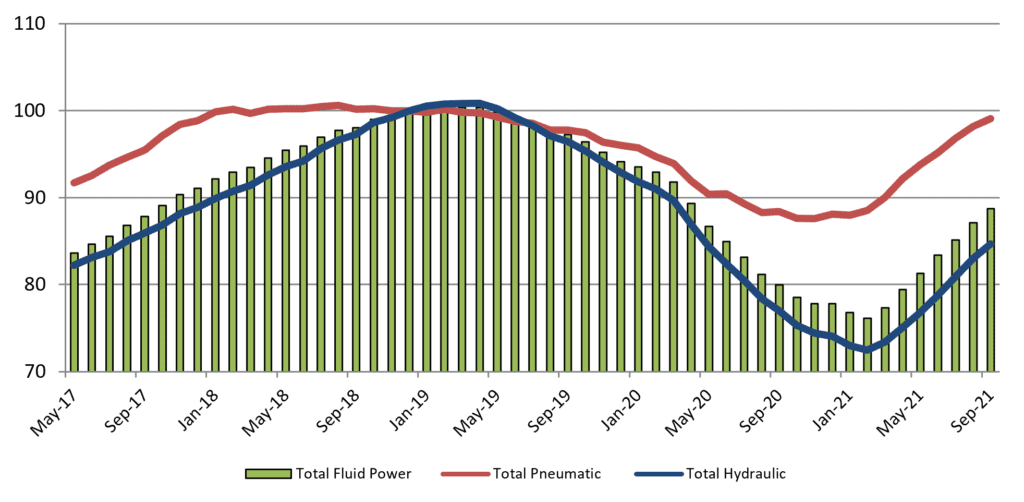
This graph of 12-month moving averages shows that in September 2021, the moving average for shipments increased across the board. (Base Year 2018 = 100)
Shipments – Cumulative year-to-date % change
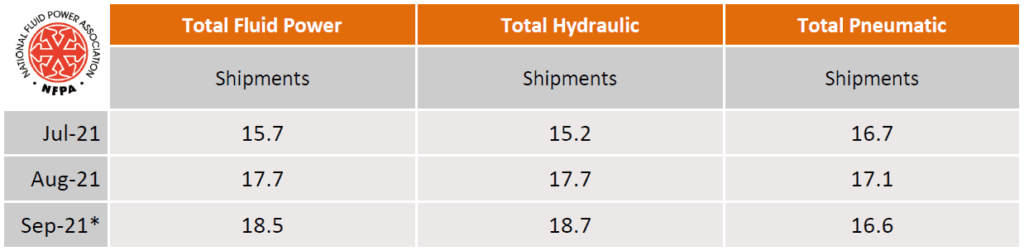
The table above is expressed in terms of cumulative percent changes. These changes refer to the percent difference between the relevant cumulative total for 2021 and the total for the same months in 2020. For example, September 2021 pneumatic shipments figure of 16.6 means that for the calendar year through September 2021, pneumatic shipments increased 16.6% compared to the same time-period in 2020.
*Preliminary data subject to revision.
Fluid Power Industry Growth Trend
Like this post? Share it!
Recent Posts

Fall 2024 Fluid Power Recruitment Event with NIU
RSVP for our Fall 2024 Fluid Power Recruitment Event with Northern Illinois University (NIU). NIU is one of seven universities recognized as a Power Partner, teaching fluid power competencies and engaging in all NFPA educational programs. At this event, your company will have the opportunity to connect directly with NIU engineering students. Engaging in meaningful conversations,…

Now Announcing: Cuyahoga Community College as a Fast Track Hub in Ohio
NFPA’s Fast Track to Fluid Power is a workforce development pathway that partners local technical colleges with fluid power industry members and high school teachers. These networks create awareness and interest in fluid power and train students along a path that leads to careers in fluid power at NFPA member companies. We are pleased to…

Now Announcing: Houston Community College as a Fast Track Hub in Texas
NFPA’s Fast Track to Fluid Power is a workforce development pathway that partners local technical colleges with fluid power industry members and high school teachers. These networks create awareness and interest in fluid power and train students along a path that leads to careers in fluid power at NFPA member companies. We are pleased to…