What you should know:
- CU data can predict turning points in general manufacturing trends, anticipate price inflation and foresee supply bottlenecks.
- CU data is included in NFPA’s Trends in Capacity Utilization.
- CU data is a strong economic indicator for fluid power.
- CU has an 91.8% correlation with Total Fluid Power Shipments.
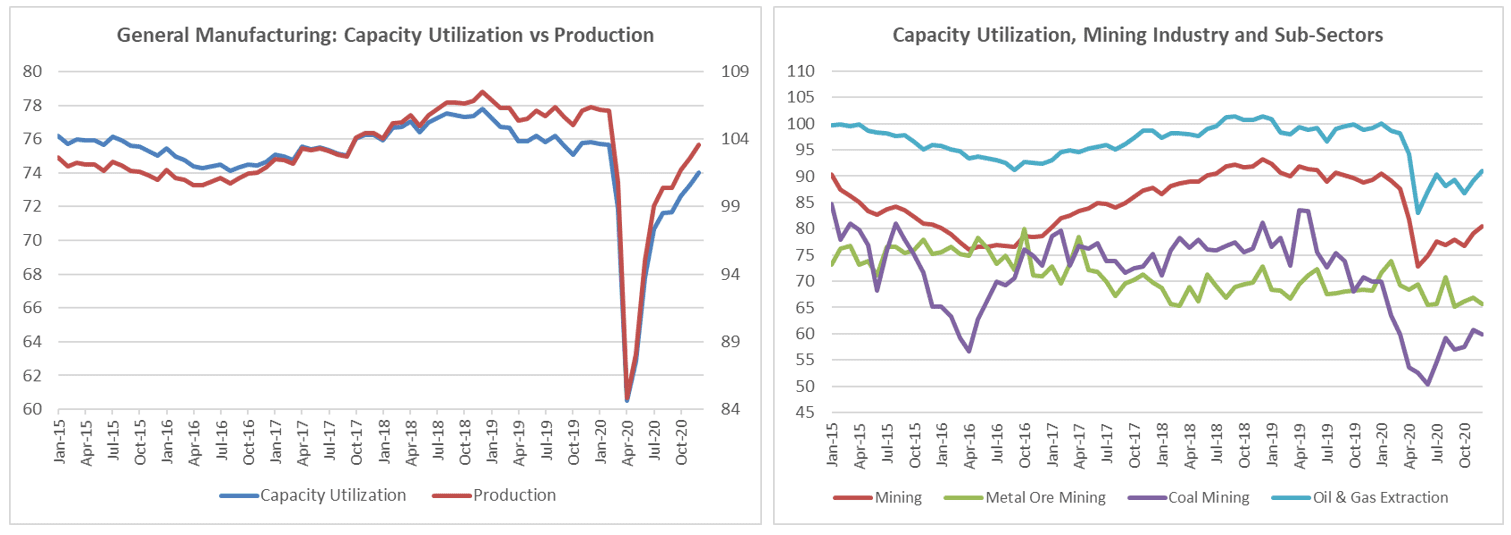
Capacity utilization index (CU), an important economic indicator, measures how engaged different industries are by measuring what percent of their plant capacity they are operating at for any given month. It is the relationship between output that is produced with the installed equipment, and the potential output which could be produced, if capacity was fully used.
CU has proven to be an accurate predictor of price inflation. As CU rises for any given manufacturing sector, producers in that sector are increasing production without increasing capitol inputs (mainly plant size). Although opinions vary, it is typically felt that when the total industry rate of CU surpasses 81% – 82%, price inflation tends to accelerate. CU for an end user market can also serve as an indicator of demand for capital inputs, such as industrial fluid power products. When CU is declining, the excess capacity means the likelihood of end users investing in new equipment decreases. As CU increases, one could expect greater investment in new equipment is much more likely. CU has also shown a rather strong inverse relationship to unemployment. As manufacturers increase production, they tend to add to their workforce and unemployment decreases as a result. High levels of CU may also lead to bottlenecks from vendors, extending lead times and a rise in backlog.
With CU’s popularity as an economic indicator among many economists and economic firms, there is no shortage of online CU news and reports. Reuters and Nasdaq commonly address trends in CU in their U.S. manufacturing and industrial production reviews, while the Federal Reserve Bank of St. Louis offers several online CU trend graphs: TCU, CAPU, FREDBLOG. CU analysis and benchmarking is also becoming commonplace on social media channels like Twitter with popular economic posters like Chad Moutray, Dr Thomas Kevin Swift, and U.S. Census Bureau.
Capacity utilization index data is collected and published by the Federal Reserve Board (FRB) through the G.17 program, along with related capacity indexes and industrial production indexes. The rate of capacity utilization equals the seasonally adjusted output index expressed as a percentage of the related capacity index. The FRB offers a large variety of CU data sets for many industry sectors for users to take a deep dive into the capacity utilization rates that are most important to their companies business planning. FRB experts also provide guidance regarding their CU data series with a monthly summary report, Current Release, with analysis emphasis on the latest monthly additions to the CU data series. The FRB takes a detailed look at how various market and industry groups are reflected in the CU data series, along with a general summary of latest monthly CU data point and how each industrial sector affected the data point.
NFPA CU Resources
NFPA familiarizes itself with those cryptic coding systems, confusing data layouts and ancient data formats that so many government and public data sources tend to use, just so we can extract, organize and release this same data in a user-friendly format as an exclusive benefit of membership. The FRB’s CU data sets fall into this category and are available in an organized fashion on NFPA’s website.
Access to CU data sets can be found in NFPA’s Trends in Capacity Utilization, along with total capacity and industrial production data sets from the FRB on a variety of different customer markets and general indicators every quarter. A selection of comparative trend graphs will help you predict turning points in general manufacturing trends, anticipate price inflation and prepare for supply bottlenecks.

NFPA’s IP Support Tools
Capacity utilization a popular economic indicator and together with NFPA’s Stats Toolkit, you can examine the strength of the relationship between your company data and CU data to determine how reliable this indicator is for you. The Correlation Analysis Report, one of five custom data analysis/visualization tools in the Stats Toolkit, helps users searching for important indicators and drivers for their company explore lead/lag and correlation analysis to recognize relationships between two data series. This report not only identifies the correlation percentage between data series for a specific date range, but also applies a monthly lead/lag effect. When shifting one data series forward (in monthly increments) to the cross-corelated data series, members can discover if the correlation percentage strengthens or weakens to possibly reveal a leading indicator for another data series.
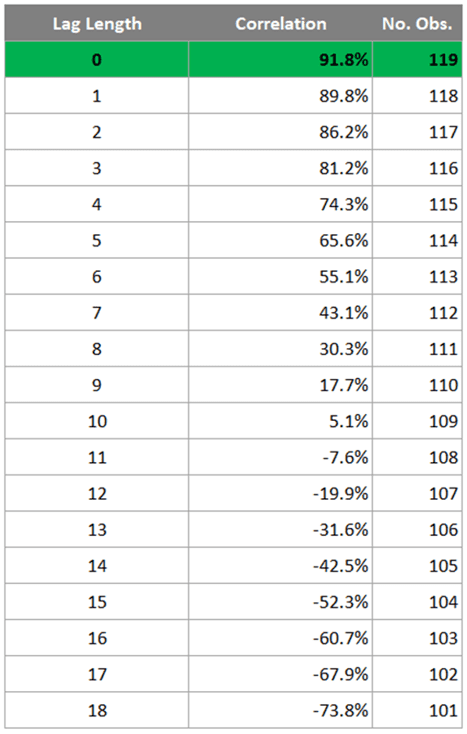
Above is an example of the Correlation Analysis Report as we examine the 119-month rate-of-change (12/12 ratio) relationship between Total Fluid Power shipments (TFP) and CU. The “correlation analysis with lags chart” identifies a correlation of 91.8% occurs when the leading series (Capacity Utilization) has a 0-month lead/lag effect applied, or Coincident Relationship. Generally, a correlation of 75% or above is deemed a very strong relationship and a good economic indicator for your industry/company.

The Correlation Analysis Report then generates a trend graph for visual confirmation of the relationship between the two data series.
Confidently evaluate the relationship between your company and CU data with the Stats Toolkit, NFPA’s cloud-based data analytics and visualization support tool that is available exclusively to NFPA members. This online platform expands our members’ economic view of their company by combining the user’s unique company data and NFPA data sources with popular analytical tools to identify market trends, recognize data relationships and develop custom projections within the fluid power industry.
Want to Learn More About this Valuable Tool? NFPA offers a 60-minute one-on-one Stats Toolkit Walkthrough Webinar that includes a detailed review of this online tool and how to operate each application, while identifying which functions are best suited for your analytical needs. Schedule a date and time with Eric Armstrong, NFPA’s Economic and Statistical Programs Manager, at earmstrong@nfpa.com or (414) 778-3372.
Like this post? Share it!
Recent Posts

Fall 2024 Fluid Power Recruitment Event with NIU
RSVP for our Fall 2024 Fluid Power Recruitment Event with Northern Illinois University (NIU). NIU is one of seven universities recognized as a Power Partner, teaching fluid power competencies and engaging in all NFPA educational programs. At this event, your company will have the opportunity to connect directly with NIU engineering students. Engaging in meaningful conversations,…

Now Announcing: Cuyahoga Community College as a Fast Track Hub in Ohio
NFPA’s Fast Track to Fluid Power is a workforce development pathway that partners local technical colleges with fluid power industry members and high school teachers. These networks create awareness and interest in fluid power and train students along a path that leads to careers in fluid power at NFPA member companies. We are pleased to…

Now Announcing: Houston Community College as a Fast Track Hub in Texas
NFPA’s Fast Track to Fluid Power is a workforce development pathway that partners local technical colleges with fluid power industry members and high school teachers. These networks create awareness and interest in fluid power and train students along a path that leads to careers in fluid power at NFPA member companies. We are pleased to…