As many of you may know, the National Fluid Power Association (NFPA) is the leading source of hydraulic and pneumatic industry data. Members get and use our data in a variety of ways to run their businesses. Part of our market information services is providing overall industry trends. Here is the latest update:
Hydraulic and Pneumatic Shipments
This graph of raw index data is generated by the total dollar volume reported to NFPA by CSS participants and compared to the average monthly dollar volume in 2018. For example, the July 2021 total dollar volume for pneumatic shipments is 97.7% of the average monthly dollar volume in 2018. (Base Year 2018 = 100)
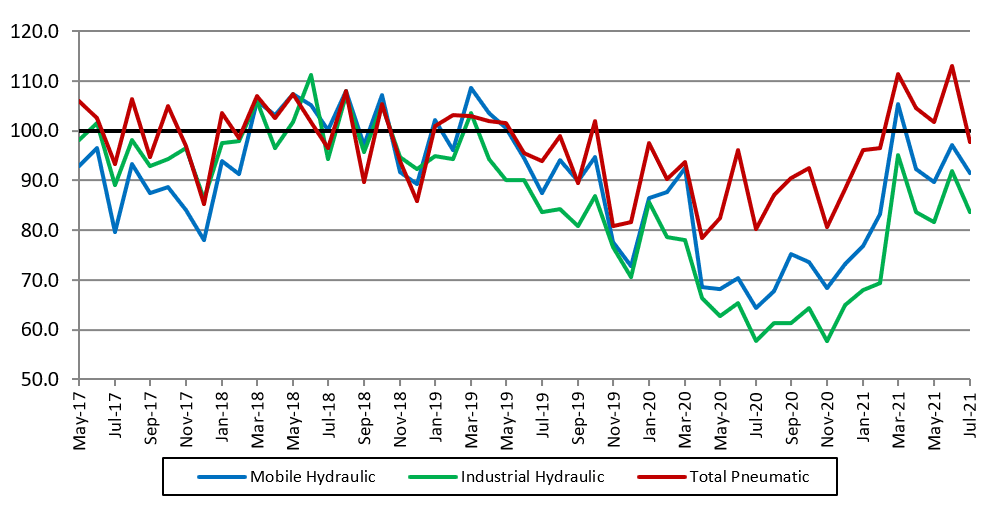
Pneumatic, Mobile and Industrial Hydraulic Orders Index
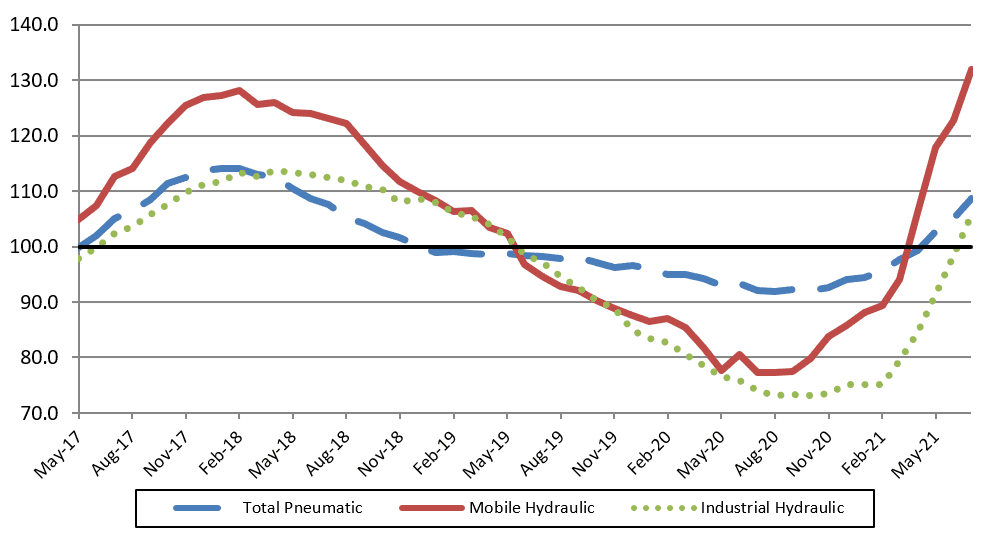
Each point on this graph represents the most recent 12 months of orders compared to the previous 12 months of orders. Each point can be read as a percentage. For example, 105.7 (the July 2021 level of the industrial hydraulic series) indicates that industrial hydraulic orders received from August 2020 to July 2021 were 105.7% of the orders received from August 2019 to July 2020. (Base Year 2018 = 100)
Total Hydraulic and Pneumatic Shipments
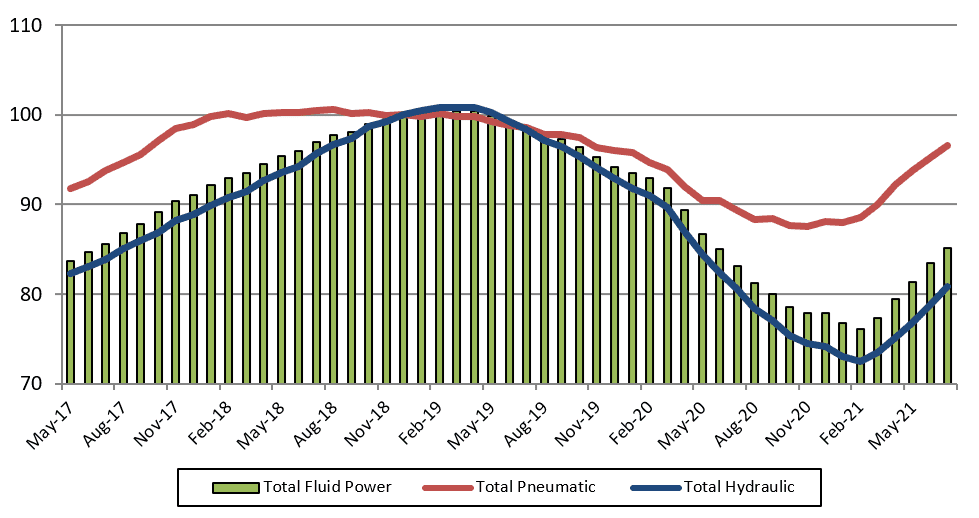
This graph of 12-month moving averages shows that in July 2021, the moving average for shipments increased across the board. (Base Year 2018 = 100)
Shipments – Cumulative year-to-date % change
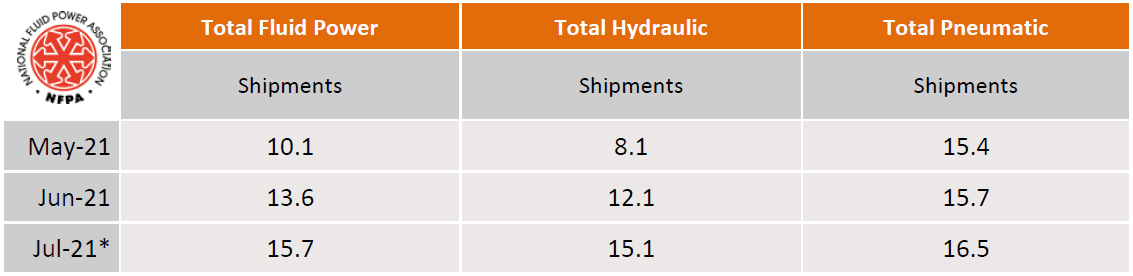
*Preliminary data subject to revision. The table above is expressed in terms of cumulative percent changes. These changes refer to the percent difference between the relevant cumulative total for 2021 and the total for the same months in 2020. For example, July 2021 pneumatic shipments figure of 16.5 means that for the calendar year through July 2021, pneumatic shipments increased 16.5% compared to the same time-period in 2020.
Fluid Power Industry Growth Trend
Like this post? Share it!
Recent Posts

Reserve Your Spot at the 2024 IEOC Lunch Tabletop Exhibition!
August 13–14, 2024The Westin Chicago Northwest, Itasca, ILLearn More | Register Get your business in front of attendees at 2024 Industry & Economic Outlook Conference (IEOC) via the new Lunch Tabletop Exhibition! For $2000*, each participating company will receive an 8-foot, black clothed table with two chairs in the location during the networking lunch break on Tuesday,…

Oxford Reports Updated: Fluid Power Forecast, By Country Briefings and Forecasts, and Monthly Industry Briefings
Global Fluid Power Report and Forecast Includes a global macro summary, by-country customer market forecast & analysis, as well as by-country fluid power industry forecasts. Countries covered in the report: US, Canada, Mexico, Brazil Poland, Netherlands, Italy, Germany, France, Belgium, UK, Russia, Taiwan, South Korea, Japan, Indonesia, India, China, Australia, UAE, and South Africa. Insights include: By Country Briefings…

NAM Regulatory Update: Q&A – The Looming 2025 Tax Challenge
As part of an effort to bring more information about the regulatory and legal environment facing American manufacturers, NFPA is monitoring the newsfeed of the National Association of Manufacturers (NAM) and will be bringing important updates like this to the attention of NFPA members. The NAM recently launched “Manufacturing Wins,” the manufacturing industry’s campaign to…