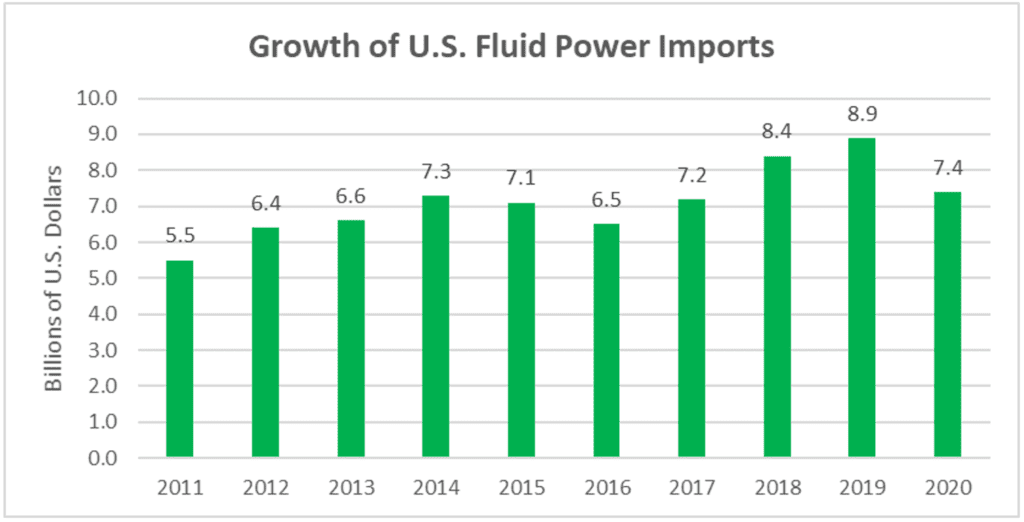
U.S. fluid power product imports fell 16.9% when compared to last year, sinking to 7.4 billion dollars in 2020. With a decline of one and half billion dollars since 2019, U.S. fluid power imports faced many of the same challenges as U.S. fluid power exports, including a recessionary economy brought on by the COVID-19 pandemic and an uncertain foreign trade environment due to unstable trade policies, unpredictable sanctions and wavering tariffs. Also, much like exports, fluid power imports maintained a trend of consistency in major trade partner rankings and leading fluid power product import rankings across the globe.
However, 2020 shouldn’t be viewed as all doom and gloom. An interesting observation with the 2020 fluid power product import decline of 16.9% is that it correlates with the overall pace of the 2020 U.S. fluid power industry decline of 17.3%, further demonstrating foreign trade’s impact on our industry. When compared against the decline of 14.3% in fluid power product exports, nearly one billion dollars, this resulted in a deficit of $1.8B, closing the trade gap by 25.5% compared to 2019. This is evidence of the U.S. fluid power industry’s ability to outpace total U.S. foreign trade, which experienced a widened 2020 U.S. trade deficit of 17.7% ($678.7B) in goods and services as noted in a recent Morningstar article.
As we look towards the future of global foreign trade, Morningstar states, “Global commerce is likely to expand further this year as the recovery is aided by low interest rates, government stimulus spending and distribution of Covid-19 vaccines.” Additional research from IHS Markit, a research firm, predicts the value of global trade will rise by 7.6% in 2021 and another 5.2% in 2022.
The future of U.S. foreign trade is further explored in Oxford Economics’ recent article, “Strong Growth Leads to Widening Trade Deficit,” found on NFPA’s Global Market Reports & Forecasts webpage. They state that “US growth is set to outperform the rest of the world in 2021 – the most since 1999 − yet the trade deficit will continue to widen,” and continue on by stating, “Beyond our baseline forecast, the balance of risks for the US economy still points to outperformance of imports relative to exports.” This all is further demonstrated in the graph below.
NFPA’s recently released 2020 U.S. Foreign Trade Data for Fluid Power Products highlighted the impact of these trends and more in this annual report containing summarized foreign trade data with a specific focus on fluid power products that are collected by the United States International Trade Commission. This report breaks down U.S. fluid power import and export activity by both country and product in a trade snapshot summary page, detailed top ten trading partners by fluid power product and trade activity trend graphs.
The pandemic-fueled 16.9% decline in 2020 U.S. fluid power imports disrupted a strong 10-year compound annual growth rate (2010-2019) of 8.3%, dropping the new 10-year annual compound growth rate (2011-2020) to 3.0%.
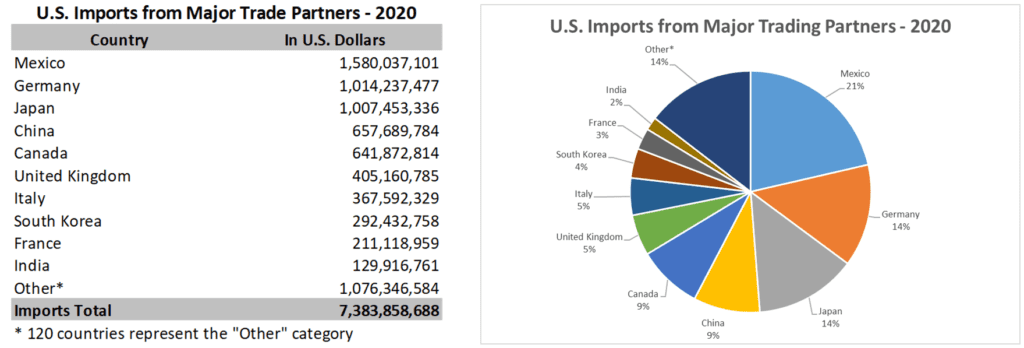
Our top ten trading partners remained the same, apart from India replacing Poland at #10, when compared 2019. Our top five trading partners represent 66% of our industry’s imports, while our top ten trading partners represent 85%. The remaining 15% of our imports is divided amongst 120 other countries.
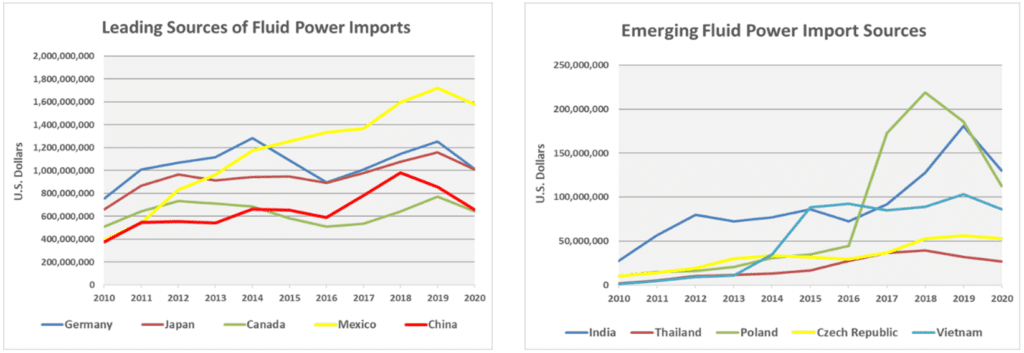
Both leading and emerging sources of fluid power imports revealed their exposure to an uncertain foreign trade environment in 2020 with declining import activity, when displayed on the trend graph above. A combination of compound annual growth rate and total fluid power product import dollars are used to determine emerging sources.
Here again, except for hydraulic valves and linear hydraulic actuators swapping spots at #1 and #2, not much has changed when it comes to our top U.S. imports by fluid power product type when compared to last year. The top five fluid power products represent 64% of all U.S. fluid power product imports, while the top ten represents nearly 94%.
All the data used to generate the graphs and information above can be found in NFPA’s 2020 Foreign Trade Report, an exclusive benefit of NFPA membership. This report is now available on the NFPA website.
Questions? Contact Eric Armstrong at earmstrong@nfpa.com or (414) 778-3372. Eric Armstrong also offers a Market Information Resource Walk-Through Webinar for those individuals who are interested in learning more about the valuable resources available with your NFPA membership.
Like this post? Share it!
Recent Posts
Member Highlights the Value of NFPA’s Conferences
At NFPA, our members’ experiences are the foundation of what we do. We’re excited to share our latest testimonial video featuring Ken Baker, CEO of Bailey International, who underscores the value of attending NFPA events. In his video, Ken highlights how the Economic & Industry Outlook Conference provides invaluable insights for his business. From the…
NAM Regulatory Update: House Passes Critical Minerals Bill
As part of an effort to bring more information about the regulatory and legal environment facing American manufacturers, NFPA is monitoring the newsfeed of the National Association of Manufacturers (NAM) and will be bringing important updates like this to the attention of NFPA members. (November 15, 2024) The House easily passed an NAM-backed bill intended…
Fall 2024 Economic Update Webinar – Recording Available
The most recent NFPA Economic Update Webinar featured Lauren Saidel-Baker of ITR Economics. Learn what to expect from a number of our industry’s most popular customer markets, while also getting the answers you need to the short-term outlook for the fluid power industry. These insights and more are available to NFPA members in the archived recording of the…


