What you should know:
- DGNO data is a strong economic indicator for fluid power
- DGNO has an 88% correlation with Total Fluid Power Shipments
- DGNO, excluding Transportation has an 92.8% correlation with Total Fluid Power Shipments
- NFPA and that Stats Toolkit make it easy for you to use DGNO as a possible leading indicator for your company
Durable Goods New Orders (DGNO) data reflects new orders placed with domestic manufacturers for delivery of long-lasting manufactured goods (durable goods) in the near term or future. Durable goods are expensive items that last three years or more, meaning companies purchase them infrequently. Examples include machinery and equipment, such as computer equipment, industrial machinery and raw steel, as well as more expensive items, such as steam shovels, tanks and airplanes. This information helps you identify what to expect from the manufacturing sector, a major component of the economy, and provides more insight into the supply chain than most indicators. It can be especially useful in understanding the earnings in industries such as machinery, technology manufacturing and transportation. This key economic indicator monitors the health of economies and provides information on how busy factories may be in the future and whether they’ll likely need to employ more or less staff to get through current workloads. A high DGNO number indicates an economy on the upswing while a low number indicates a downward trajectory.
Both ITR Economics and Oxford Economics often reference DGNO in NFPA market information resources and NFPA event presentations as both an indicator of U.S. economic activity and a strong economic indicator for the U.S. fluid power industry. Many news and social media sources also continuously monitor and report on the trends involving DGNO. For example, both CNBC and Advisor Perspectives report on recent trends in DGNO in their economic coverage.
Chad Moutray, Chief Economist for the National Association of Manufacturers (NAM), commonly posts a variety of economic trend analysis and updates for manufacturing on Twitter (@chadmoutray) and very recently posted on DGNO trends:
New orders for manufactured goods rose 1.1% in September, increasing for the fifth straight month. Durable and nondurable goods sales were up 1.9% and 0.3% in September, respectively. Excluding transportation equipment, new durable goods orders increased by 0.9% for the month. pic.twitter.com/yHids4vvhJ
— Chad Moutray (@chadmoutray) November 3, 2020
Certainly, some much needed positive news during these trying times.
DGNO is collected monthly and published by the U.S. Census Bureau in two releases per month: the Advance Report on Durable Goods and the Manufacturers’ Shipments, Inventories, and Orders. Both reports are very similar, including several summaries of U.S. manufacturers’ activity and data charts of monthly activity and analysis, with the Manufacturers’ Shipments, Inventories, and Orders report including more detailed categories regarding the breakdown of manufacturers by industry. The U.S. Census Bureau’s Manufacturers’ Shipments, Inventories, & Orders webpage offers full access to both reports and historical data.
NFPA DGNO Resources
NFPA familiarizes itself with cryptic coding systems, confusing data layouts and ancient data formats so we can extract, organize and release this same data in a user-friendly format as an exclusive benefit of membership. The U.S. Census Bureau’s DGNO is available in a comprehensible format on NFPA’s website.
Access to key customer market and leading indicator data series such as the DGNO data sets are available via NFPA’s Customer Market File (CMF) on the NFPA website. The CMF is a monthly file containing data and trend graphs for key U.S. customer markets, popular economic indicators and producer pricing for your own internal analysis needs or for within analytical tools such as NFPA’s Stats Toolkit.

NFPA’s DGNO Support Tools
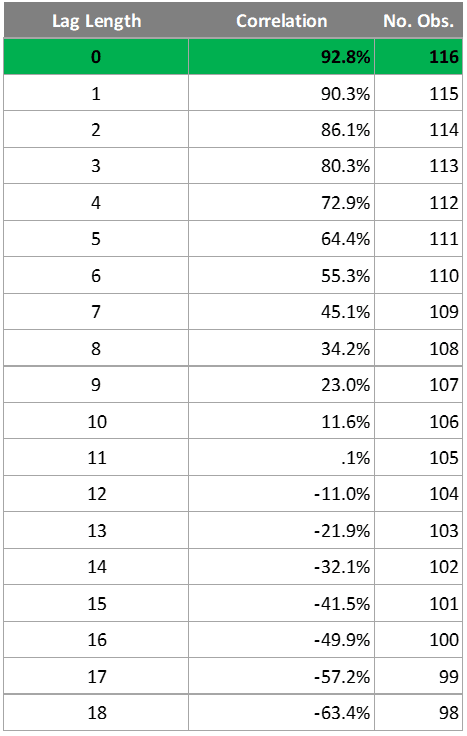
What is your company’s relationship to DGNO data? Take your analysis to the next level with NFPA’s Stats Toolkit and examine the strength of the relationship between your company data and DGNO data to discover just how reliable this indicator is. The Correlation Analysis Report, one of five custom data analysis/visualization tools in the Stats Toolkit, explores lead/lag and correlation analysis to identify relationships between two data series. This report not only shows the correlation percentage between data series for a specific date range, but also applies a monthly lead/lag effect. When shifting one data series forward (in monthly increments) to the cross-corelated data series, members can discover if the correlation percentage strengthens or weakens to possibly reveal a leading indicator for another data series.

Above is an example of the Correlation Analysis Report in which we examine the 116-month relationship between Total Fluid Power shipments (TFP) and DGNO. The “correlation analysis with lags chart” identifies a correlation of 88.0% occurs when the leading series (Durable Goods New Orders) has a 0-month lead/lag effect applied, or Coincident Relationship. Generally, a correlation of 75% or above is deemed a very strong relationship and a good economic indicator for your industry/company.

The Correlation Analysis Report also generates a trend graph that applies no lead to the leading series (DGNO) for visual confirmation of the relationship between the two data series.
In the next example above, we examine the 116-month relationship between Total Fluid Power shipments (TFP) and Durable Orders Excluding Transportation, a narrower focus on DGNO that excludes transportation equipment and is also included in NFPA’s Customer Market File (CMF). The “correlation analysis with lags chart” identifies an even stronger correlation of 92.8% occurs when the leading series (Durable Orders Excluding Transportation) has a Coincident Relationship applied.
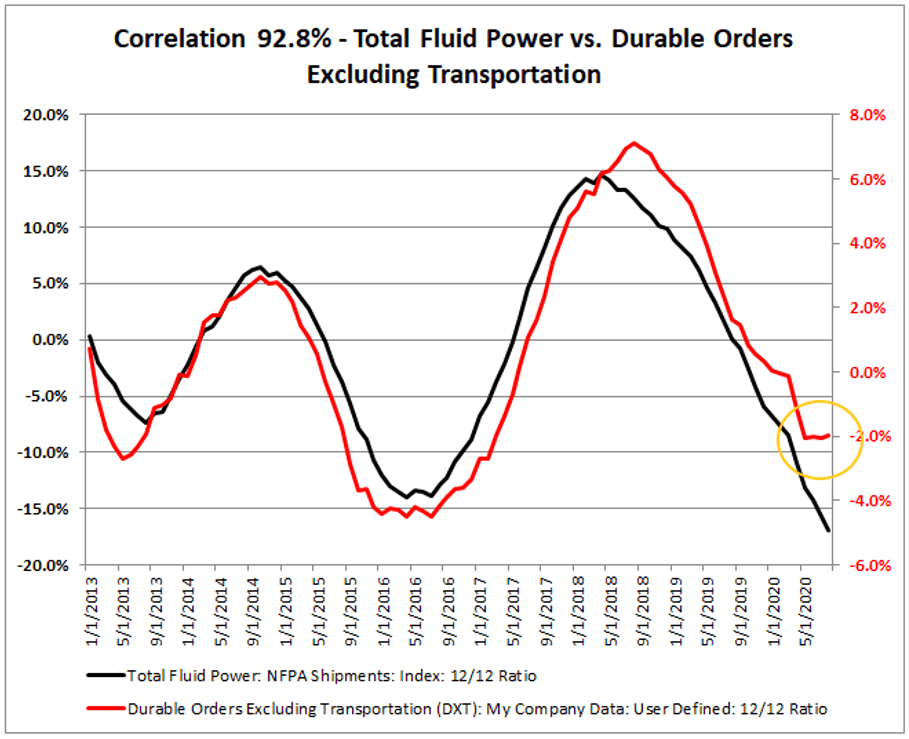
After generating a trend graph that applies no lead to the leading series (Durable Orders Excluding Transportation) for visual confirmation of the relationship between the two data series, a noticeable flattening/growth trend has taken place the last several months (circled in orange) with this indicator. This trend may signify that the U.S. fluid power industry is turning the corner and will begin to flatten and eventually enter recovery. However, this may also have a negative effect on the correlation between these two data series moving forward. Because of this, it’s important to double-check their relationship/correlation often. It’s not uncommon for extreme depression/recovery-like events to have a disruptive effect on economic indicators relationship with other data series.
With a little assistance from NFPA’s market information resource benefits, anyone engaged in the fluid power supply chain can access the data and tools they need to confidently evaluate the relationship between their company and DGNO data.
Access NFPA Market Information Resources
NFPA’s timely and accurate industry statistics help members understand trends and anticipate change with a variety of industry reports, forecasts and data sources for fluid power products, customer markets and economic indicators.
Questions? Contact Eric Armstrong, NFPA’s Economic and Statistical Programs Manager, at earmstrong@nfpa.com or (414) 778-3372.
Like this post? Share it!
Recent Posts

Member Highlights the Value of NFPA’s Conferences
At NFPA, our members’ experiences are the foundation of what we do. We’re excited to share our latest testimonial video featuring Ken Baker, CEO of Bailey International, who underscores the value of attending NFPA events. In his video, Ken highlights how the Economic & Industry Outlook Conference provides invaluable insights for his business. From the…

NAM Regulatory Update: House Passes Critical Minerals Bill
As part of an effort to bring more information about the regulatory and legal environment facing American manufacturers, NFPA is monitoring the newsfeed of the National Association of Manufacturers (NAM) and will be bringing important updates like this to the attention of NFPA members. (November 15, 2024) The House easily passed an NAM-backed bill intended…

Fall 2024 Economic Update Webinar – Recording Available
The most recent NFPA Economic Update Webinar featured Lauren Saidel-Baker of ITR Economics. Learn what to expect from a number of our industry’s most popular customer markets, while also getting the answers you need to the short-term outlook for the fluid power industry. These insights and more are available to NFPA members in the archived recording of the…