As many of you may know, the National Fluid Power Association (NFPA) is the leading source of hydraulic and pneumatic industry data. Members get and use our data in a variety of ways to run their businesses. Part of our market information services is providing overall industry trends. Here is the latest update:
Hydraulic and Pneumatic Shipments
This graph of raw index data is generated by the total dollar volume reported to NFPA by CSS participants and compared to the average monthly dollar volume in 2018. For example, the January 2021 total dollar volume for pneumatic shipments are 96.1% of the average monthly dollar volume in 2018. (Base Year 2018 = 100)
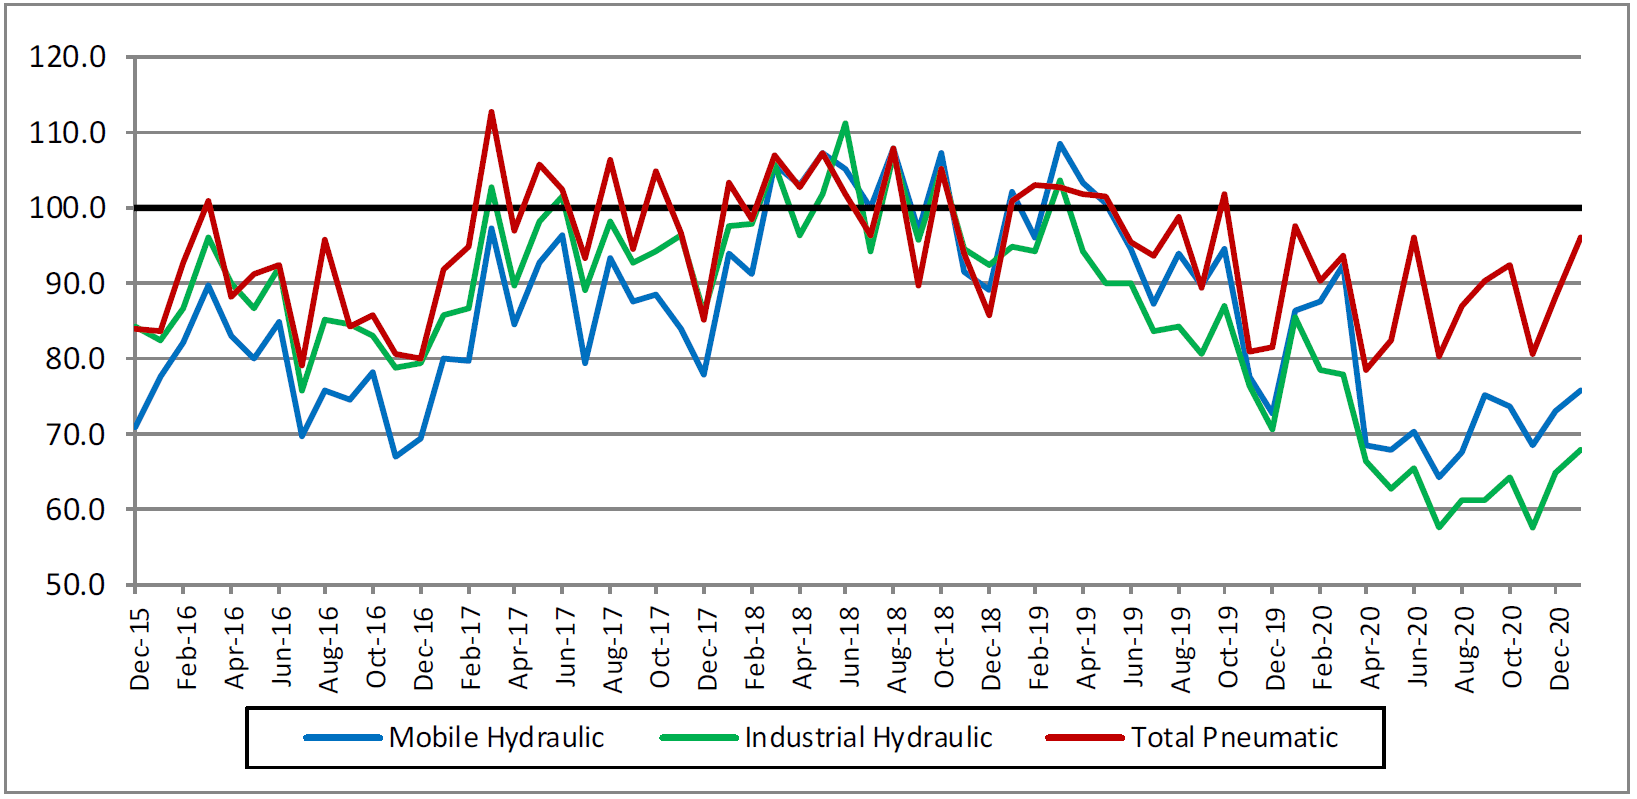
Pneumatic, Mobile and Industrial Hydraulic Orders Index

Each point on this graph represents the most recent 12 months of orders compared to the previous 12 months of orders. Each point can be read as a percentage. For example, 75.2 (the December 2020 level of the industrial hydraulic series) indicates that industrial hydraulic orders received from January 2020 to December 2020 were 75.2% of the orders received from January 2019 to December 2019. (Base Year 2018 = 100)
Total Hydraulic and Pneumatic Shipments
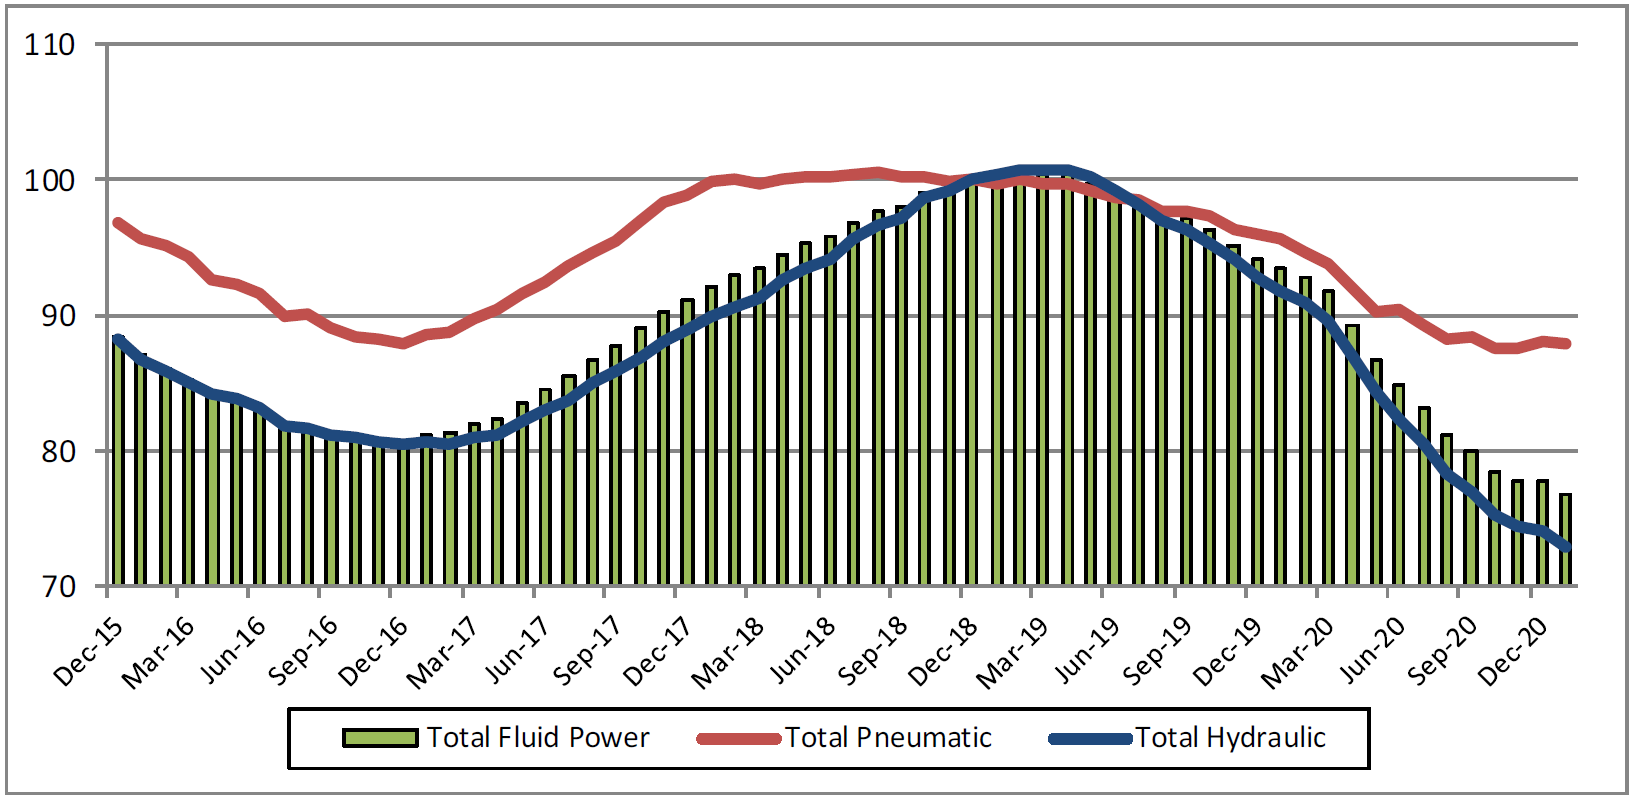
This graph of 12‐month moving averages shows that in January 2021, both hydraulic shipments and pneumatic shipments decreased. (Base Year 2018 = 100)
Shipments – Cumulative year-to-date % change (2020 vs. 2019)
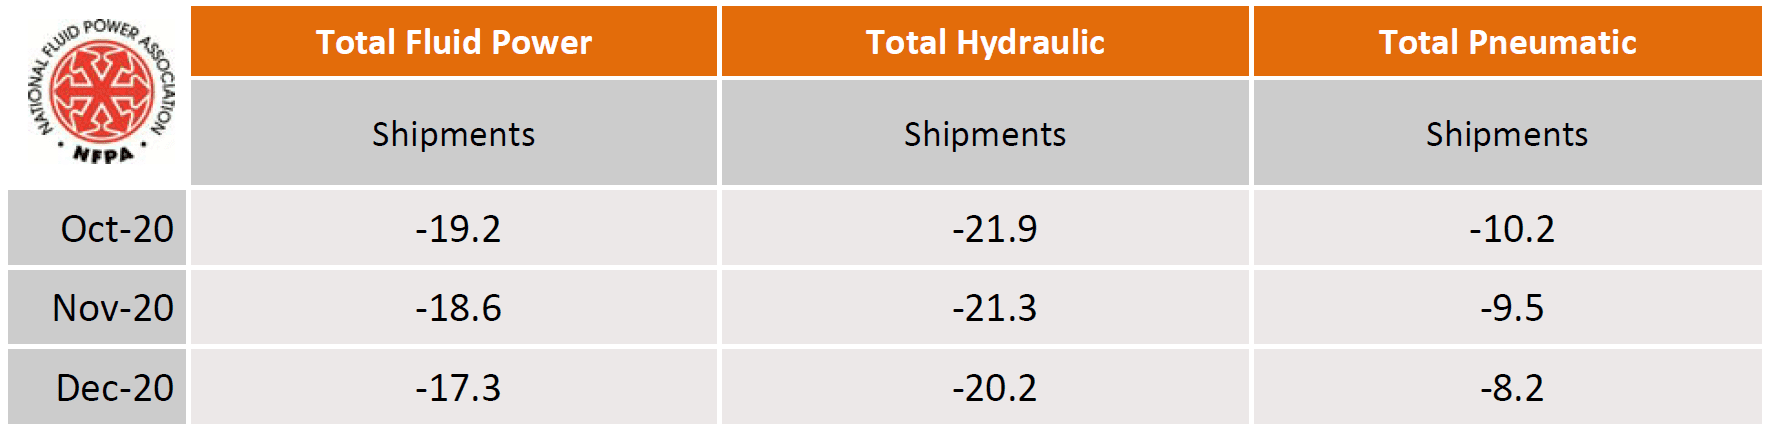
The table above is expressed in terms of cumulative percent changes. These changes refer to the percent difference between the relevant cumulative total for 2020 and the total for the same months in 2019. For example, December 2020 pneumatic shipments figure of ‐8.2 means that for the calendar year through December 2020, pneumatic shipments decreased 8.2% compared to the same time‐period in 2019. (Base Year 2018 = 100)
Fluid Power Industry Growth Trend
Like this post? Share it!
Recent Posts

Q1-Q3 2024 US Trade Data Updated: Mexico Dominates Fluid Power Trade with US
The first three quarters of USITC 2024 data have been released, revealing how it has been measuring up to last year’s US import and export levels of fluid power products. US fluid power exports are on course finishing the year with a growth rate whereas fluid power imports to the US are behind schedule. 2023-dollar…

NAM Regulatory Update: Small Manufacturers: Congress Must Restore Full Expensing
As part of an effort to bring more information about the regulatory and legal environment facing American manufacturers, NFPA is monitoring the newsfeed of the National Association of Manufacturers (NAM) and will be bringing important updates like this to the attention of NFPA members. (October 17, 2024) As part of the NAM’s “Manufacturing Wins” tax…

Breaking the Mold: Inspiring Paths to Leadership in the Fluid Power Industry
This episode of Fluid Power Forum features Jeff Behling, President and CEO of STAUFF Corporation. Listen to the Podcast Here Jeff’s journey from the shop floor to the executive suite is a testament to the power of perseverance, continuous learning, and seizing opportunities. His story is relevant not just because of his unique background but…