As many of you may know, the National Fluid Power Association (NFPA) is the leading source of hydraulic and pneumatic industry data. Members get and use our data in a variety of ways to run their businesses. Part of our market information services is providing overall industry trends. Here is the latest update:
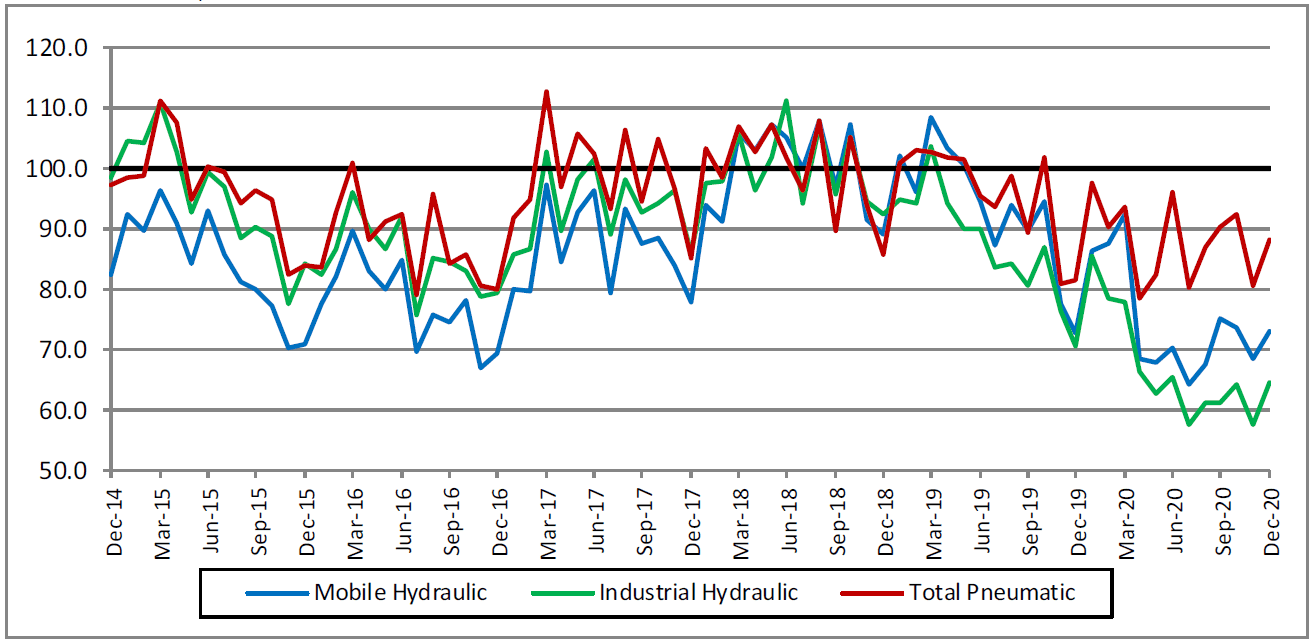
Hydraulic and Pneumatic Shipments
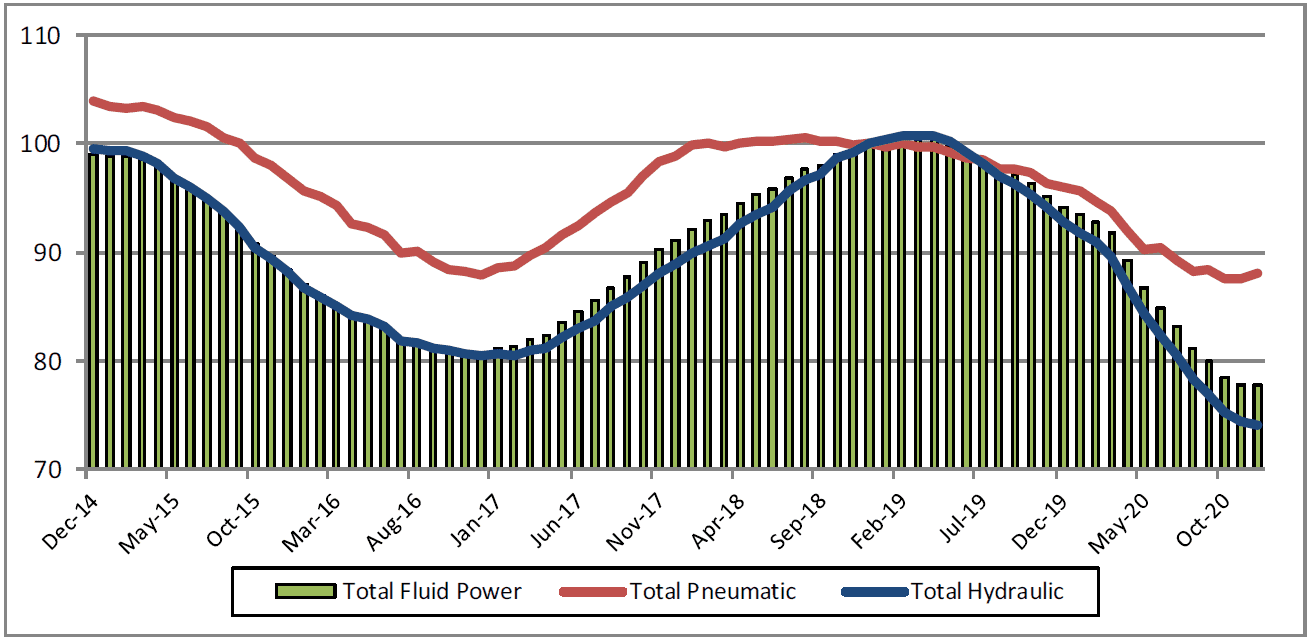
This graph of raw index data is generated by the total dollar volume reported to NFPA by CSS participants and compared to the average monthly dollar volume in 2018. For example, the December 2020 total dollar volume for pneumatic shipments are 88.2% of the average monthly dollar volume in 2018. (Base Year 2018 = 100)
Pneumatic, Mobile and Industrial Hydraulic Orders Index
Each point on this graph represents the most recent 12 months of orders compared to the previous 12 months of orders. Each point can be read as a percentage. For example, 73.4 (the November 2020 level of the industrial hydraulic series) indicates that industrial hydraulic orders received from December 2019 to November 2020 were 73.4% of the orders received from December 2018 to November 2019. (Base Year 2018 = 100)
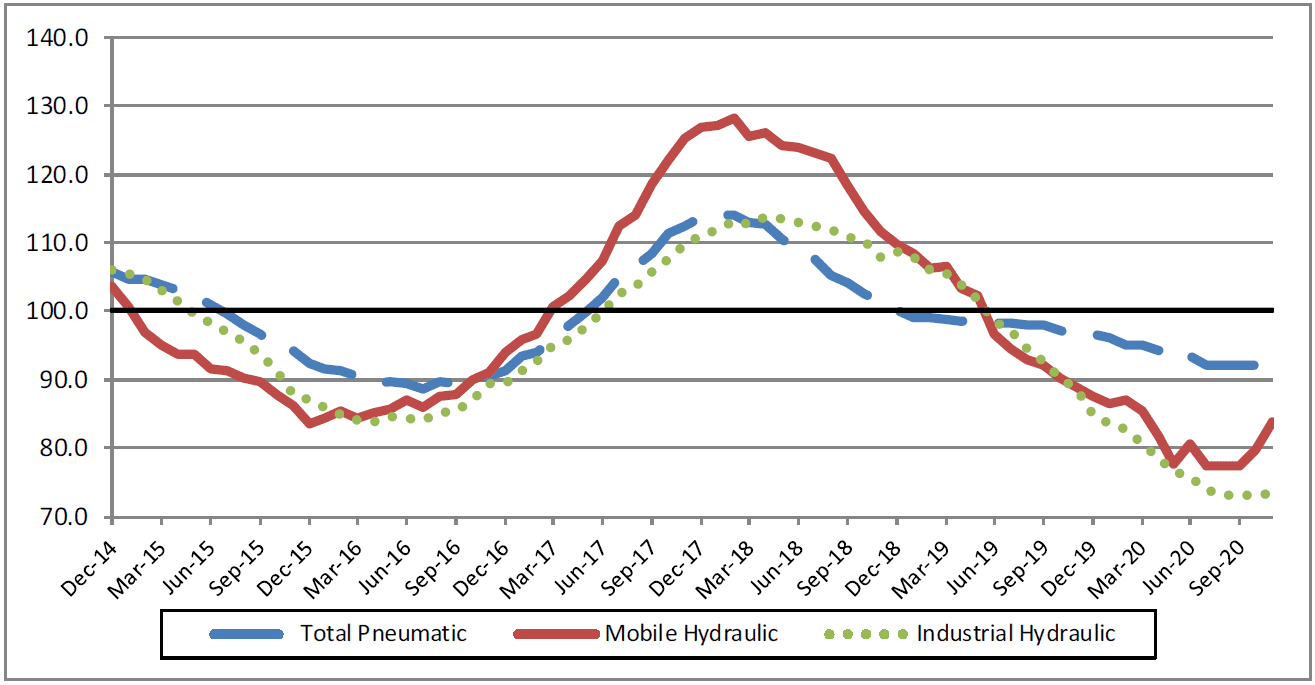
Total Hydraulic and Pneumatic Shipments
This graph of 12‐month moving averages shows that in December 2020, hydraulic shipments decreased and pneumatic shipments increased. (Base Year 2018 = 100)
Shipments – Cumulative year-to-date % change (2020 vs. 2019)
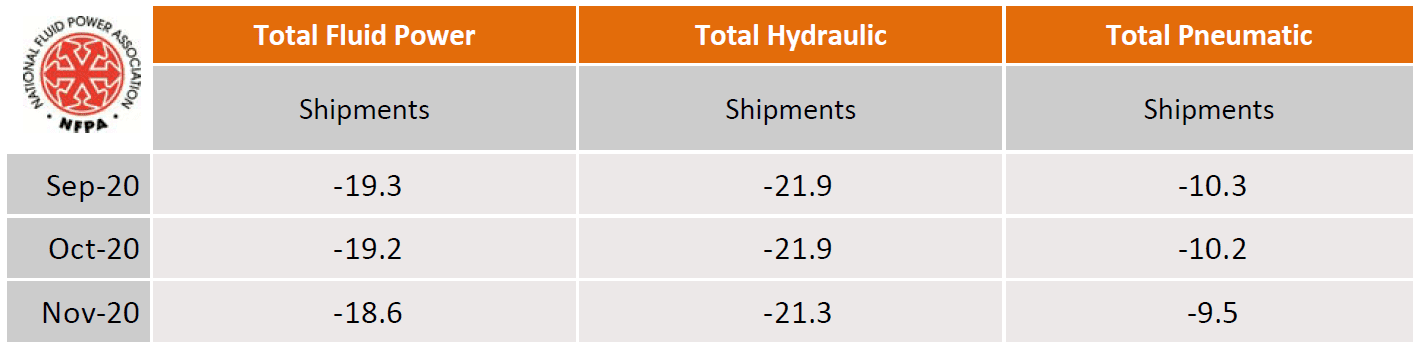
The table above is expressed in terms of cumulative percent changes. These changes refer to the percent difference between the relevant cumulative total for 2020 and the total for the same months in 2019. For example, November 2020 pneumatic shipments figure of ‐9.5 means that for the calendar year through November 2020, pneumatic shipments decreased 9.5% compared to the same time‐period in 2019. (Base Year 2018 = 100)
Fluid Power Industry Growth Trend
Like this post? Share it!
Recent Posts

Update to Regional Demand Estimates Report Now Available
The U.S. Fluid Power Regional Demand Estimates Report has been updated with 2023 estimates and is now available for download. This Excel-based report is prepared for NFPA by Oxford Economics and profiles the geographic distribution of fluid power products to end-use industries by state, including fluid power sales dollars, fluid power sales percentage, and number of…

Hear from an NCAT Student Engaged in NFPA Workforce Programs
We’re excited to share a new testimonial video from David Castro Lastor, a junior mechanical engineering student at North Carolina Agricultural and Technical State University and president of the university’s Fluid Power Club. In his video, David shares how participating in NFPA programs has shaped his academic and personal growth. Through his leadership in the…
")
New Episode of Fluid Power Forum: Advanced Modeling Techniques and Performance Comparisons of Electrohydraulic Systems
Today, our guest is Bruno Dupuis. Bruno is a Corporate Accounts Manager at Famic Technologies Inc., the company behind the development of Automation Studio™, a circuit design and simulation software for fluid power, electrical, robotics, process control and automation projects. He presented at NFPA’s Hydraulics Conference co-located at the 2024 iVT EXPO back in August.…