Looking for a strong leading indicator to help plan forward over the next couple quarters? Look no farther than the NFPA State of Fluid Power Industry Survey (SOFP).
SOFP is easy to participate in each month; more importantly, the results are powerful. Just answer a few quick opinion-based questions via an online survey. The SOFP strongly predicts industry performance in the eight months ahead.
If you don’t receive the SOFP results in your email each month, contact Cecilia Bart at cbart@nfpa.com or 414-259-2027. If someone from your company is already completing the survey, we’ll just add you to the list and send it your way each month. If someone isn’t, we’ll send you this quick and easy survey each month, and when you fill it out, we’ll send the reports.
————————————-
NFPA conducts two monthly surveys with its manufacturer members. The State of the Fluid Power (SOFP) survey asks members quick questions about the current state and future of the industry, while Confidential Shipment Statistics (CSS) tracks orders and shipments of fluid power components.
One of the questions asked in the SOFP survey reads, “How will the next 12 months of shipments compare to the last 12 months of shipments”, with answer options as:
- Above
- The Same
- Below
This question is posed for pneumatics, mobile hydraulics, and industrial hydraulics specifically. It turns out, in NFPA’s CSS survey, we collect shipment values for those three categories as well. This posed the question: Does SOFP predict CSS?
The SOFP question (how will the next 12 months of shipments compare to the last 12 months of shipments?) is essentially asking respondents to predict, directionally, the 12/12 rate of change. These answers are tallied and converted into a diffusion index resulting in a number from 0 to 100 (0 = 100% of responses were “below” while 100 = 100% of responses were “above”).
What we have done below is plot the SOFP diffusion indexes for pneumatic, mobile hydraulic, and industrial hydraulic against the same CSS shipments indexes graphed with a 12/12 rate of change. Given the predictive nature of the SOFP index, we can shift the index forward to line up peaks and troughs, effectively creating a leading indicator.
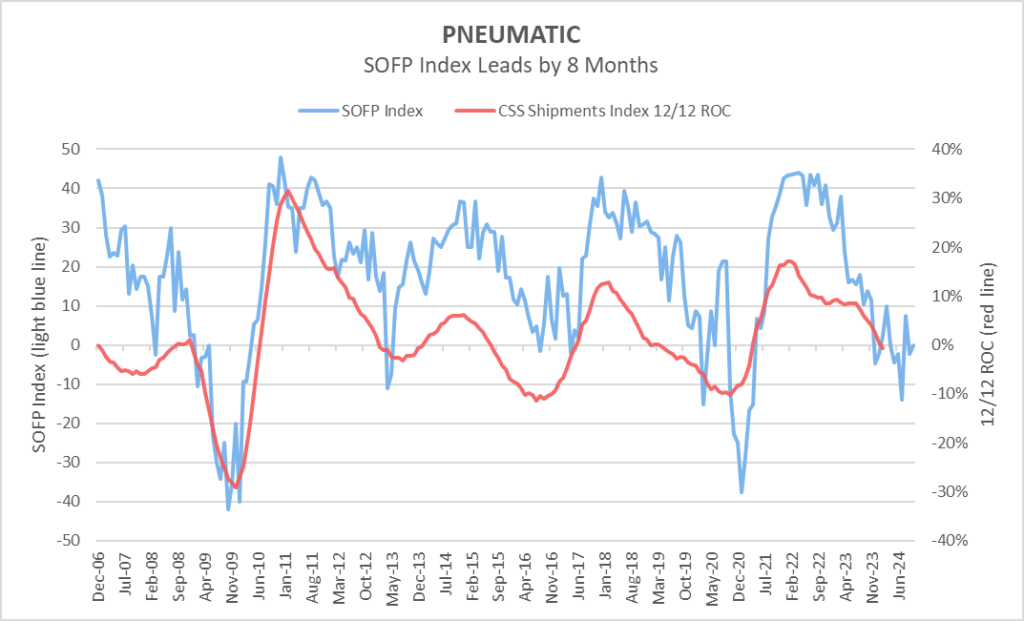
Pneumatic:
Lining up peaks and troughs puts the SOFP index 8 months ahead of the CSS 12/12 rate of change. Looking to the far right of the graph, the SOFP index is predicting a leveling out trend in the coming months. It’s difficult to say whether this is a false plateau until the SOFP begins to consistently increase again. The CSS shipments 12/12 have been on a visible decline since mid to late 2023 and have not leveled out. It will be interesting to see if the CSS 12/12 plateaus soon, as the SOFP index predicts.
Mobile Hydraulic:
Like pneumatic, the mobile hydraulic SOFP index is also shifted forward 8 months to line up peaks and troughs. Since mid-2023, the SOFP index has been trending downwards despite the latest spike. The CSS shipments 12/12 leveled out in mid-2022 to early 2023 but have since been trending downwards since mid-2023 following the movement of the SOFP index.
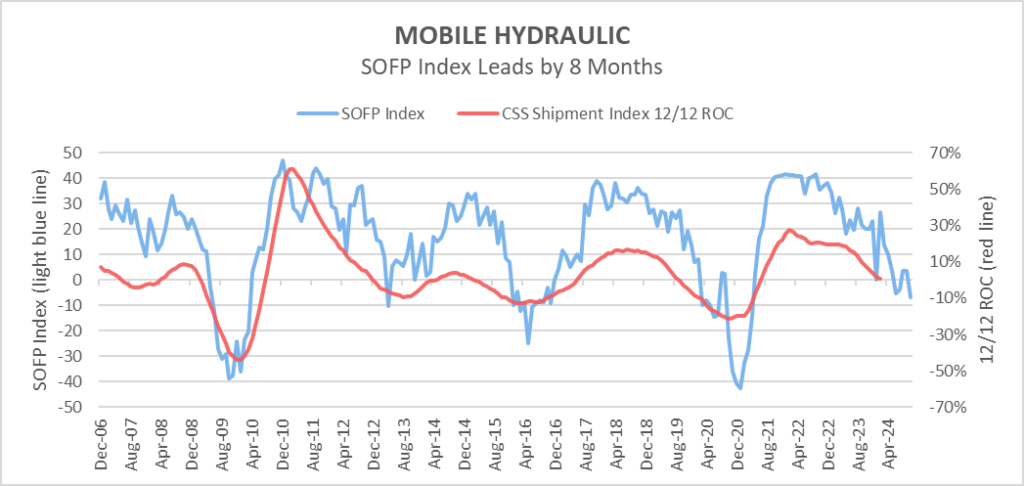
Note: SOFP index was shifted to revolve around 0 for this graph.
Industrial Hydraulic:
The Industrial hydraulic SOFP index follows suit being shifted forward 8 months to line up peaks and troughs. The SOFP index is trending downwards but spiked upward in the most recent month. The CSS shipments 12/12 are clearly declining following the overall trend of the SOFP index. The spike in the SOFP index is likely volatility but should be watched to see if it begins to trend upwards soon. ITR Economics in their Q1 NFPA Forecast Report suggest that NFPA Total Shipments rise will resume at the start of 2025. Because the SOFP Index leads by 8 months, we’re nearing the survey period when SOFP surveys will indicate CSS shipment trends at the beginning of 2025.
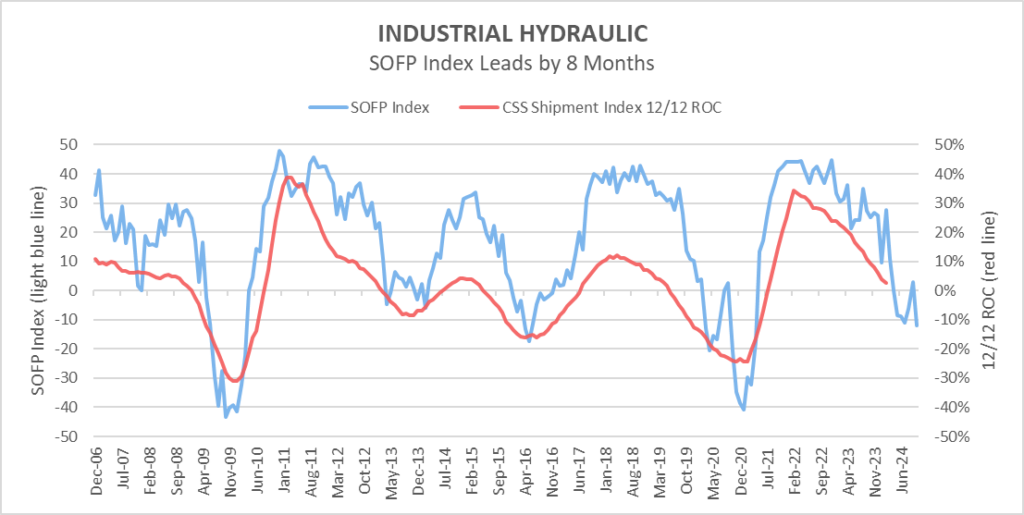
Note: SOFP index was shifted to revolve around 0 for this graph.
This data is available to participants in each respective survey. If you have questions or want more info on how to participate in these surveys, don’t hesitate to reach out.
Questions? Contact Cecilia Bart at cbart@nfpa.com or 414-259-2027.
Like this post? Share it!
Recent Posts

Fall 2024 Fluid Power Recruitment Event with NIU
RSVP for our Fall 2024 Fluid Power Recruitment Event with Northern Illinois University (NIU). NIU is one of seven universities recognized as a Power Partner, teaching fluid power competencies and engaging in all NFPA educational programs. At this event, your company will have the opportunity to connect directly with NIU engineering students. Engaging in meaningful conversations,…

Now Announcing: Cuyahoga Community College as a Fast Track Hub in Ohio
NFPA’s Fast Track to Fluid Power is a workforce development pathway that partners local technical colleges with fluid power industry members and high school teachers. These networks create awareness and interest in fluid power and train students along a path that leads to careers in fluid power at NFPA member companies. We are pleased to…

Now Announcing: Houston Community College as a Fast Track Hub in Texas
NFPA’s Fast Track to Fluid Power is a workforce development pathway that partners local technical colleges with fluid power industry members and high school teachers. These networks create awareness and interest in fluid power and train students along a path that leads to careers in fluid power at NFPA member companies. We are pleased to…