NFPA’s Econ and Market Indicators (EMI) report pulls together data from multiple sources to provide the latest trends for:
- Customer Markets (U.S. Census Bureau)
- Economic Indicators (U.S. Census Bureau)
- Industrial Production (Federal Reserve)
- Capacity Utilization (Federal Reserve)
- Producer Price Index (Bureau of Labor Statistics)
Oxford’s Monthly Industry Briefings contain the latest developments for eleven major industries around the globe with short industry briefs provided by Oxford Economics. These two-to-three-page briefs include a short-written summary, output/trend graphs, and an output table.
Highlights between the two on a few industries focusing on the United States include the following:
- Aerospace
- EMI indicates that in February, aerospace products and parts machinery manufacturing shipments bounced up 22% m/m from January’s previous drop. According to Oxford, global air travel demand has nearly returned to pre-pandemic levels. When glancing at aerospace products and part’s shipments in the EMI dashboard with the 12-month moving average, we can see a gradual climbing towards the historical peak in 2018. Additionally, EMI reflects that the aerospace products and part’s industrial production index is trending upwards in y/y % change, 3/12, and 12/12 rates of change, further corroborating a period of growth for this sector.
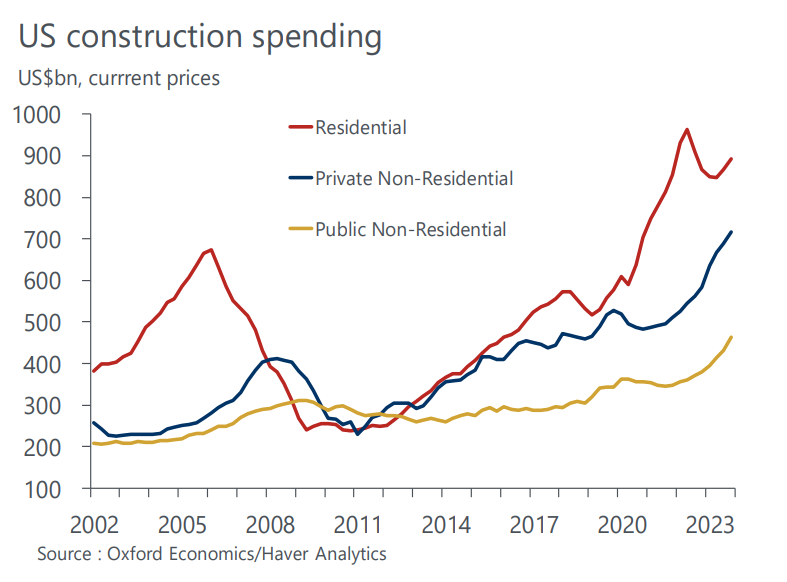
- Construction
- The EMI report indicates construction machinery manufacturing shipments were up 4.3% m/m in February 2024 and 10.2% y/y. Oxford saw Total US housing rebound in February, growing by 10.7%. The Midwest continues to host the largest US housing growth of 50% m/m with the South second at a distance with 15.7% m/m, according to Oxford. The chart below shows US construction spending across three major categories increasing into the beginning of 2024.
- Motor Vehicles
- Motor vehicles and parts machinery manufacturing shipments improved 8.3% m/m in February according to the EMI report. February’s automobile, light truck, and utility vehicle industrial production index of 130.33 falling short of all time high of 132.41 recorded in February 2020. This is the highest recorded index in that category post Covid-19. Oxford notes the uptick in selling rates for light vehicles in the US reflecting an increase in consumer spending, however current credit conditions are cited as a drag on this market until interest rates are lowered.
The EMI report can be accessed at this link: https://nfpahub.com/reports/econ-market-indicator/. An excel file with all the raw data is also available to download for internal analysis. Members can view individual series and apply different calculations such as moving averages and rates of change.
Oxford Monthly Industry Briefings can be accessed at this link: https://nfpahub.com/stats/reports-data/global-market-reports-forecasts/industry-briefings/
Questions? Contact Cecilia Bart at cbart@nfpa.com or 414-259-2027.
Like this post? Share it!
Recent Posts

Fall 2024 Fluid Power Recruitment Event with NIU
RSVP for our Fall 2024 Fluid Power Recruitment Event with Northern Illinois University (NIU). NIU is one of seven universities recognized as a Power Partner, teaching fluid power competencies and engaging in all NFPA educational programs. At this event, your company will have the opportunity to connect directly with NIU engineering students. Engaging in meaningful conversations,…

Now Announcing: Cuyahoga Community College as a Fast Track Hub in Ohio
NFPA’s Fast Track to Fluid Power is a workforce development pathway that partners local technical colleges with fluid power industry members and high school teachers. These networks create awareness and interest in fluid power and train students along a path that leads to careers in fluid power at NFPA member companies. We are pleased to…

Now Announcing: Houston Community College as a Fast Track Hub in Texas
NFPA’s Fast Track to Fluid Power is a workforce development pathway that partners local technical colleges with fluid power industry members and high school teachers. These networks create awareness and interest in fluid power and train students along a path that leads to careers in fluid power at NFPA member companies. We are pleased to…