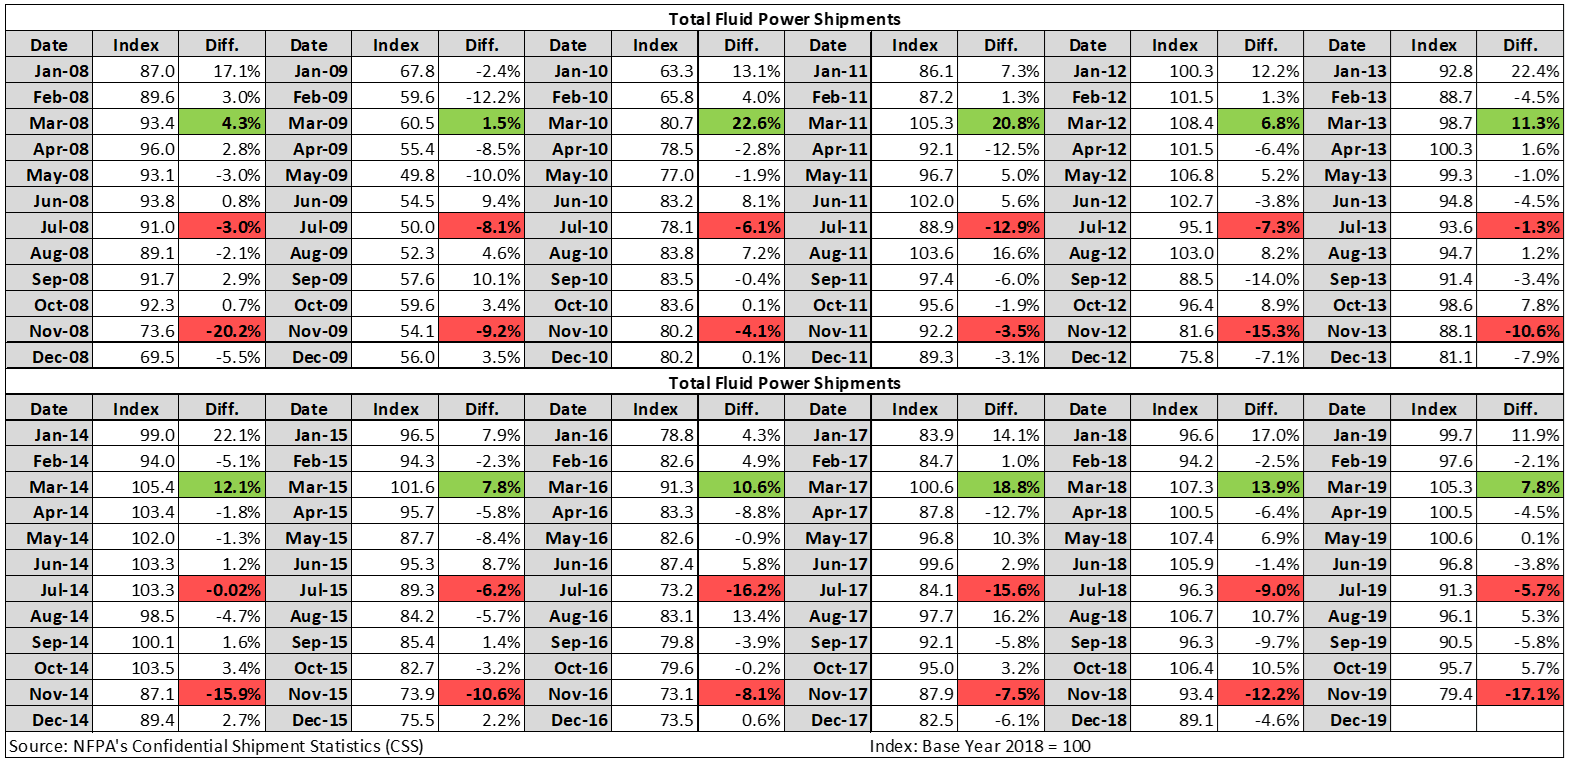
In a continued annual news series on trends in fluid power shipments, we again examine three very consistent trends worth watching over the last twelve years using “month-to-month % change” analysis on historical shipments index data from NFPA’s Confidential Shipment Statistics Program. First, let us revisit the trends and historical analysis from last year’s article:
- An increase in shipments from February to March. 12-year Average Increase: +11.5%
- A decrease in shipments from June to July. 12-year Average Decrease: -7.6%
- A decrease in shipments from October to November. 12-year Average Decrease: -11.2%
When re-examining the consistency of these trends after updating the twelve-year period by removing 2008 and including 2020 to the “month-to-month % change” analysis of fluid power shipments (see below), the results reveal a continued consistency in all three trends:
- An increase in shipments from February to March. 12-year Average Increase: +11.3%
- A decrease in shipments from June to July. 12-year Average Decrease: -8.1%
- A decrease in shipments from October to November. 12-year Average Decrease: -10.3%
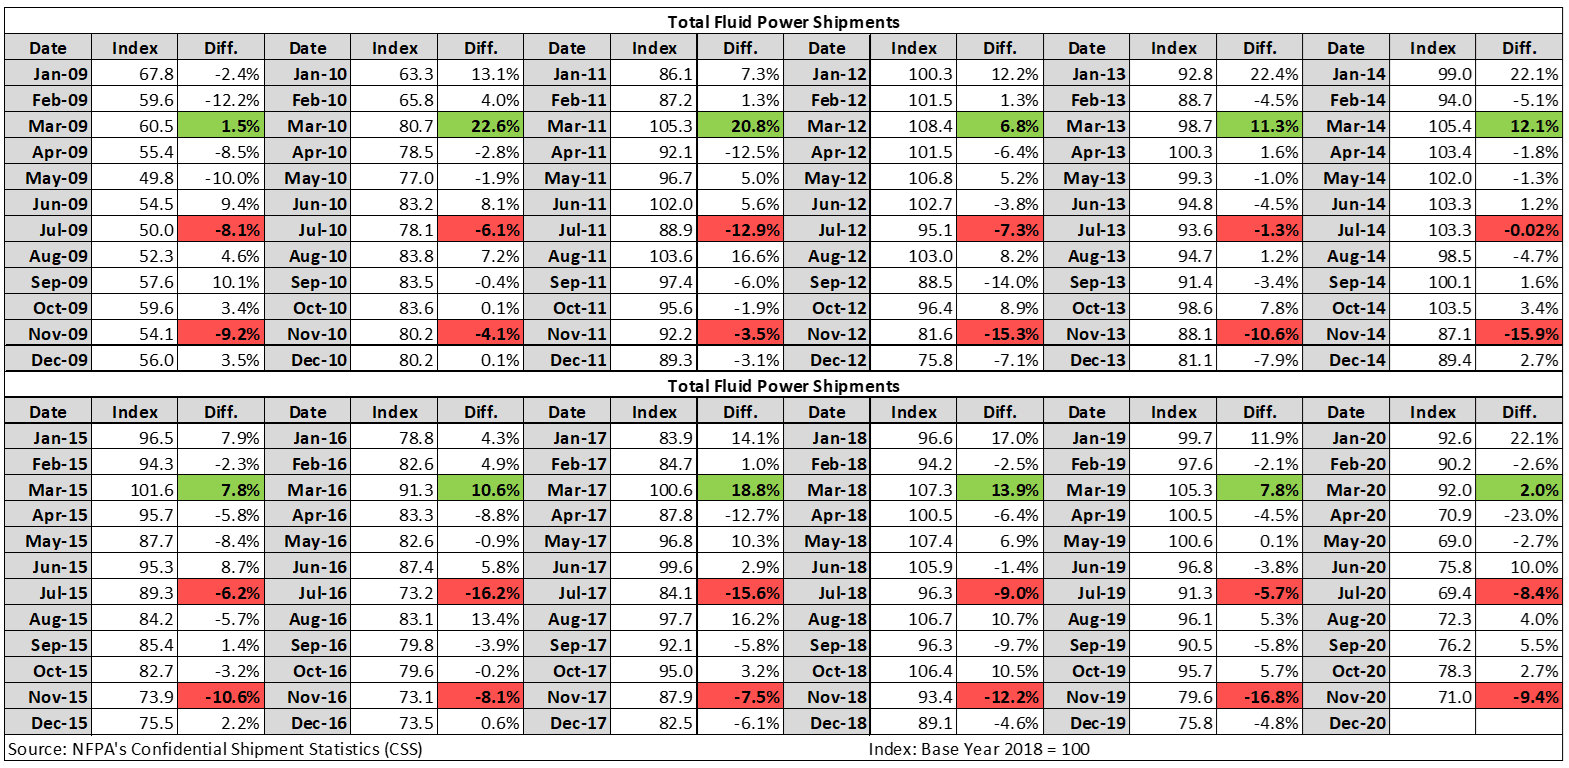
Despite three major downturns (the 2009 and 2015/2016 recessions and the 2020 COVID-19 downturn) during the examined time span, the trends remained consistent.
Also worth noting is an emerging fourth consistent trend: an increase in shipments from December to January. Over the last 12 years, this trend has proven true every year except for 2009, due to the major recession that began late 2008.
Continue tracking these and many other fluid power industry trends with NFPA’s Confidential Shipment Statistics Program.
The Confidential Shipments Statistics (CSS) Program: The CSS Program is the only monthly source of aggregated industry data for the US fluid power industry. This report presents data on monthly shipments and orders collected from our membership and helps users understand trends and anticipate change within the industry. Member companies can benchmark their own company’s performance against overall industry performance using the CSS results. Data is collected from participating US fluid power manufacturers, compiled by a 3rd party to maintain confidentiality, and results are then only sent to CSS participants. Click here to enroll in CSS online.
Questions and inquiries about the Confidential Shipment Statistics (CSS) program can be directed to Eric Armstrong at earmstrong@nfpa.com or (414) 778-3372.
Like this post? Share it!
Recent Posts

Q1-Q3 2024 US Trade Data Updated: Mexico Dominates Fluid Power Trade with US
The first three quarters of USITC 2024 data have been released, revealing how it has been measuring up to last year’s US import and export levels of fluid power products. US fluid power exports are on course finishing the year with a growth rate whereas fluid power imports to the US are behind schedule. 2023-dollar…

NAM Regulatory Update: Small Manufacturers: Congress Must Restore Full Expensing
As part of an effort to bring more information about the regulatory and legal environment facing American manufacturers, NFPA is monitoring the newsfeed of the National Association of Manufacturers (NAM) and will be bringing important updates like this to the attention of NFPA members. (October 17, 2024) As part of the NAM’s “Manufacturing Wins” tax…

Breaking the Mold: Inspiring Paths to Leadership in the Fluid Power Industry
This episode of Fluid Power Forum features Jeff Behling, President and CEO of STAUFF Corporation. Listen to the Podcast Here Jeff’s journey from the shop floor to the executive suite is a testament to the power of perseverance, continuous learning, and seizing opportunities. His story is relevant not just because of his unique background but…