The National Fluid Power Association (NFPA) is the leading source of hydraulic and pneumatic industry data.
Plan Your Next Move
NFPA’s industry reports, outlook surveys, forecasts, and data sources allow our members to understand trends and anticipate change with a variety of trend graphs and data analysis for fluid power products, customer markets, and economic indicators.
Expert Analysis and Hard Data
Dynamic conferences, meetings and webinars keep our members up to date on the latest economic conditions, emerging trends, and industry insights for today’s ever-changing economic climate.
You have the Ideas, We Provide the Tools
From point-and-click online tools that automate time-consuming calculations, trend analysis, and custom forecasting to a user-friendly web dashboard that allows members custom access to industry information.
Find out how to become part of NFPA, or get more information on NFPA Market Information, by contacting Sam Diedrich at sdiedrich@nfpa.com or 414-778-3372.
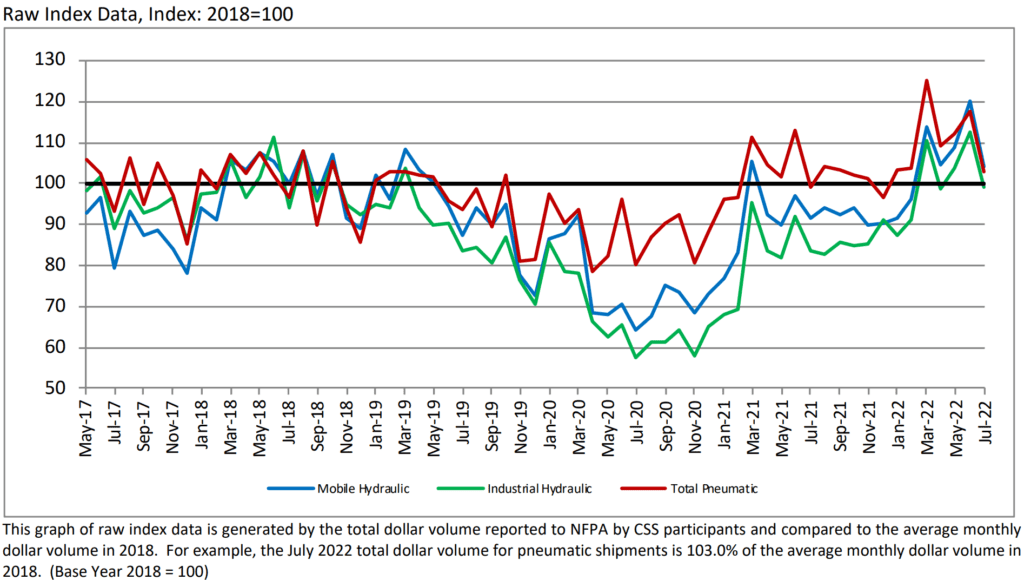
Hydraulic and Pneumatic Shipments
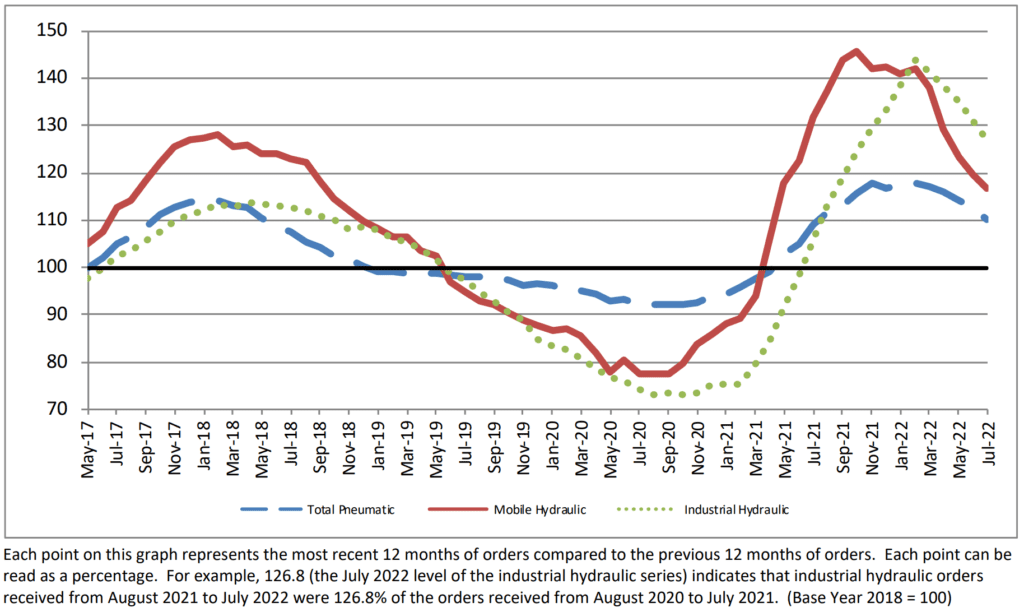
Pneumatic, Mobile and Industrial Hydraulic Orders 12/12 Ratio
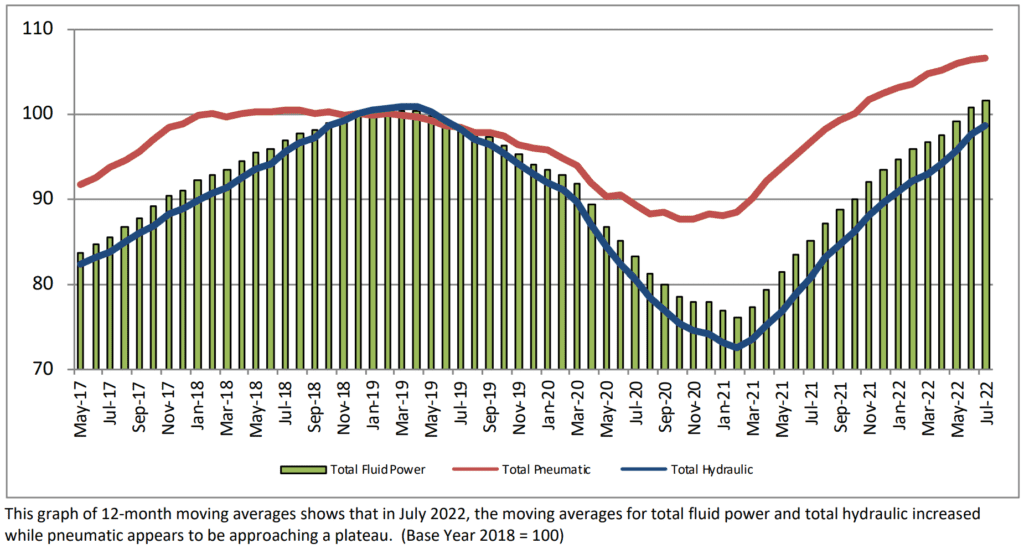
Total – Hydraulic and Pneumatic Shipments 12 Month Moving Average
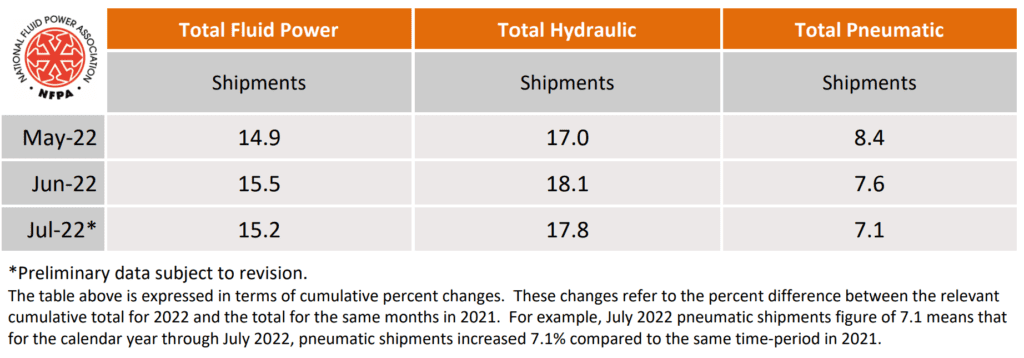
Shipments – Cumulative year-to-date % change (2022 vs. 2021)
Fluid Power Industry Growth Trend
The latest data published by the National Fluid Power Association shows the 12 month moving
average of shipments for hydraulics and total fluid power continue to grow, while pneumatics is
approaching a plateau. The year-to-date % change for total fluid power shipments in July 2022 is
15.2%. Mobile hydraulic orders received from August 2021 to July 2022 are currently 116.7% of the
orders received from August 2020 to July 2021. When looking at raw index data, pneumatic, mobile
hydraulic, and industrial hydraulic shipments all decreased when compared to last month. These
charts are drawn from data collected from more than 80 manufacturers of fluid power products by
NFPA’s Confidential Shipment Statistics (CSS) program. Much more information is available to NFPA
members, which allows them to better understand trends and anticipate change in their market and
the customer markets they serve. Contact NFPA at 414-778-3344 for more info.
Like this post? Share it!
Recent Posts
NFPA Board Meets; Advances Effective Forum and Educated Workforce Objectives Copy
NFPA Well Positioned for Growth and Impactby Eric Lanke, NFPA President/CEO Back in June, our then-new Board chair, Jim Kaas, wrote about the discussions held at the Board’s annual strategic retreat, and many of the strategic initiatives the Board is helping NFPA move forward in service of NFPA members: Now it’s October, and the NFPA…

Exhibit Space Sales Set to Open on September 3 for CONEXPO-CON/AGG 2026
As a supporting organization of CONEXPO-CON/AGG 2026, the largest construction equipment show in North America, NFPA is pleased to confirm that the show will feature a components product concentration area for eligible components, including hydraulics, that sell product to OEMs. Placement in the product concentration area will be determined by priority points, and NFPA members will earn…

Reserve Your Spot at the 2024 IEOC Lunch Tabletop Exhibition!
August 13–14, 2024The Westin Chicago Northwest, Itasca, ILLearn More | Register Get your business in front of attendees at 2024 Industry & Economic Outlook Conference (IEOC) via the new Lunch Tabletop Exhibition! For $2000*, each participating company will receive an 8-foot, black clothed table with two chairs in the location during the networking lunch break on Tuesday,…