As many of you may know, the National Fluid Power Association (NFPA) is the leading source of hydraulic and pneumatic industry data. Members get and use our data in a variety of ways to run their businesses. Part of our market information services is providing overall industry trends. Here is the latest update:
Hydraulic and Pneumatic Shipments
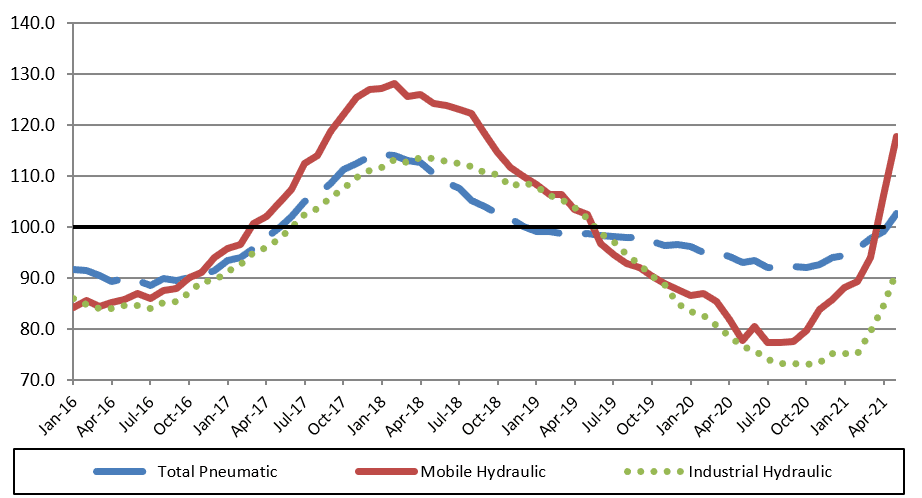
This graph of raw index data is generated by the total dollar volume reported to NFPA by CSS participants and compared to the average monthly dollar volume in 2018. For example, the May 2021 total dollar volume for pneumatic shipments is 100.5% of the average monthly dollar volume in 2018. (Base Year 2018 = 100)
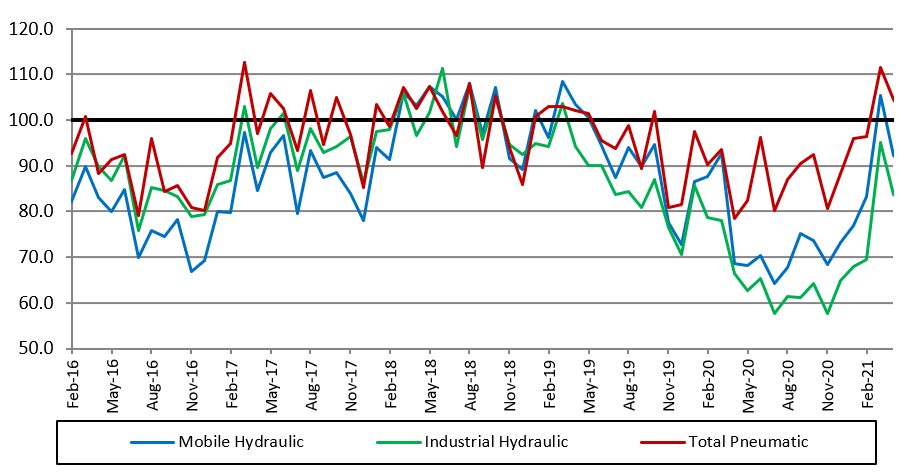
Pneumatic, Mobile and Industrial Hydraulic Orders Index
Each point on this graph represents the most recent 12 months of orders compared to the previous 12 months of orders. Each point can be read as a percentage. For example, 91.3 (the May 2021 level of the industrial hydraulic series) indicates that industrial hydraulic orders received from June 2020 to May 2021 were 91.3% of the orders received from June 2019 to May 2020. (Base Year 2018 = 100)
Total Hydraulic and Pneumatic Shipments
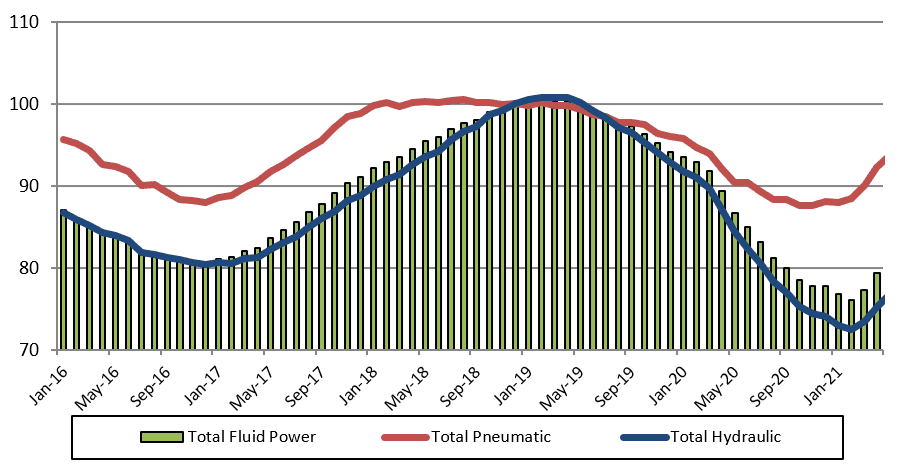
This graph of 12-month moving averages shows that in May 2021, the moving average for shipments increased across the board. (Base Year 2018 = 100)
Shipments – Cumulative year-to-date % change
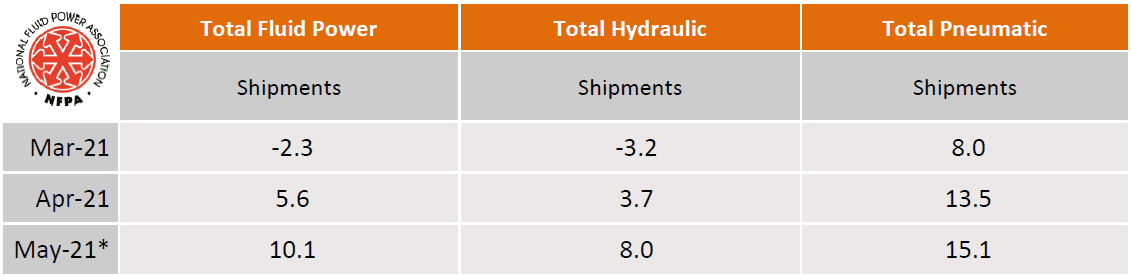
*Preliminary data subject to revision. The table above is expressed in terms of cumulative percent changes. These changes refer to the percent difference between the relevant cumulative total for 2021 and the total for the same months in 2020. For example, May 2021 pneumatic shipments figure of 15.1 means that for the calendar year through May 2021, pneumatic shipments increased 15.1% compared to the same time-period in 2020.
Fluid Power Industry Growth Trend
Like this post? Share it!
Recent Posts

Member Highlights the Value of NFPA’s Conferences
At NFPA, our members’ experiences are the foundation of what we do. We’re excited to share our latest testimonial video featuring Ken Baker, CEO of Bailey International, who underscores the value of attending NFPA events. In his video, Ken highlights how the Economic & Industry Outlook Conference provides invaluable insights for his business. From the…

NAM Regulatory Update: House Passes Critical Minerals Bill
As part of an effort to bring more information about the regulatory and legal environment facing American manufacturers, NFPA is monitoring the newsfeed of the National Association of Manufacturers (NAM) and will be bringing important updates like this to the attention of NFPA members. (November 15, 2024) The House easily passed an NAM-backed bill intended…

Fall 2024 Economic Update Webinar – Recording Available
The most recent NFPA Economic Update Webinar featured Lauren Saidel-Baker of ITR Economics. Learn what to expect from a number of our industry’s most popular customer markets, while also getting the answers you need to the short-term outlook for the fluid power industry. These insights and more are available to NFPA members in the archived recording of the…